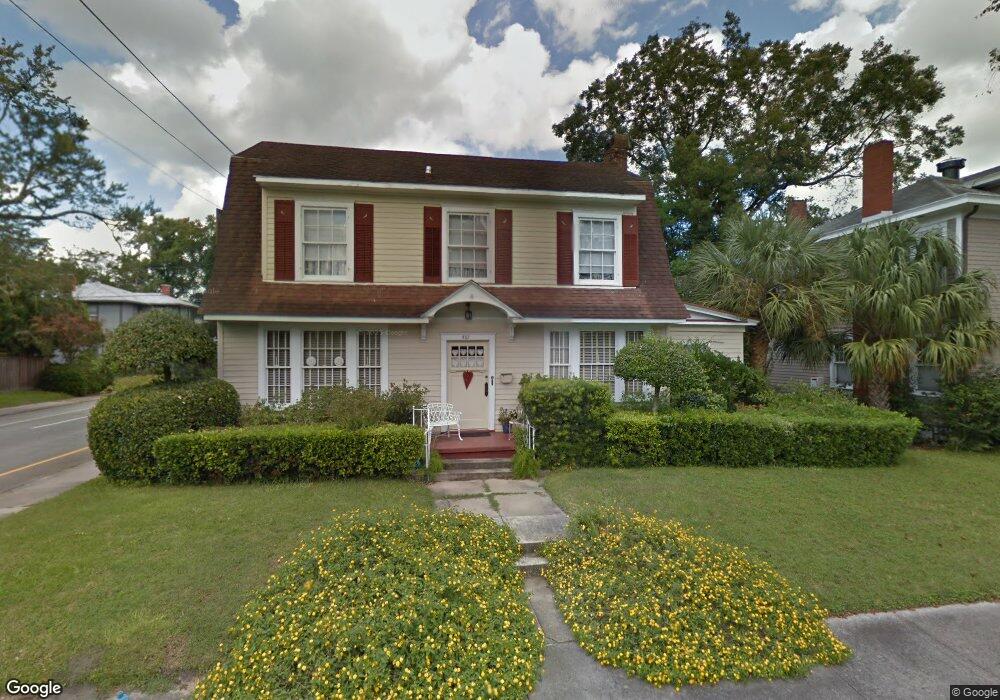
502 E 41st St Savannah, GA 31401
Midtown Savannah NeighborhoodEstimated Value: $541,000 - $734,000
3
Beds
2
Baths
2,172
Sq Ft
$292/Sq Ft
Est. Value
About This Home
This home is located at 502 E 41st St, Savannah, GA 31401 and is currently estimated at $635,309, approximately $292 per square foot. 502 E 41st St is a home located in Chatham County with nearby schools including Shuman Elementary School, Hubert Middle School, and Savannah Arts Academy.
Ownership History
Date
Name
Owned For
Owner Type
Purchase Details
Closed on
Apr 7, 2025
Sold by
Gartrell Fred Douglas J
Bought by
Gartrell Margaret E and Gartrell Fred Douglas
Current Estimated Value
Purchase Details
Closed on
Feb 19, 2025
Sold by
Jackson Teddy
Bought by
Jackson Teddy and Gartrell Fred Douglas
Purchase Details
Closed on
Jan 2, 2025
Sold by
Gartrell Fred Douglas
Bought by
Gartrell Fred Douglas and Jackson Teddy
Purchase Details
Closed on
Dec 28, 2024
Sold by
Gartrell Fred Douglas
Bought by
Jackson Teddy and Gartrell Fred Douglas
Purchase Details
Closed on
Dec 1, 2021
Sold by
Gartrell Fred D
Bought by
Gartrell Sherry W
Create a Home Valuation Report for This Property
The Home Valuation Report is an in-depth analysis detailing your home's value as well as a comparison with similar homes in the area
Home Values in the Area
Average Home Value in this Area
Purchase History
| Date | Buyer | Sale Price | Title Company |
|---|---|---|---|
| Gartrell Margaret E | -- | -- | |
| Jackson Teddy | -- | -- | |
| Gartrell Fred Douglas | -- | -- | |
| Jackson Teddy | -- | -- | |
| Jackson Teddy | -- | -- | |
| Gartrell Sherry W | -- | -- |
Source: Public Records
Tax History
| Year | Tax Paid | Tax Assessment Tax Assessment Total Assessment is a certain percentage of the fair market value that is determined by local assessors to be the total taxable value of land and additions on the property. | Land | Improvement |
|---|---|---|---|---|
| 2025 | $3,983 | $208,360 | $41,600 | $166,760 |
| 2024 | $33 | $172,560 | $41,600 | $130,960 |
| 2023 | $1,506 | $185,080 | $41,600 | $143,480 |
| 2022 | $274 | $155,320 | $28,000 | $127,320 |
| 2021 | $269 | $132,880 | $20,000 | $112,880 |
| 2020 | $256 | $131,720 | $20,000 | $111,720 |
| 2019 | $550 | $131,720 | $20,000 | $111,720 |
| 2018 | $411 | $115,240 | $20,000 | $95,240 |
| 2017 | $148 | $120,560 | $23,160 | $97,400 |
| 2016 | $183 | $109,120 | $23,160 | $85,960 |
| 2015 | $311 | $103,640 | $23,160 | $80,480 |
| 2014 | $295 | $113,000 | $0 | $0 |
Source: Public Records
Map
Nearby Homes
Your Personal Tour Guide
Ask me questions while you tour the home.