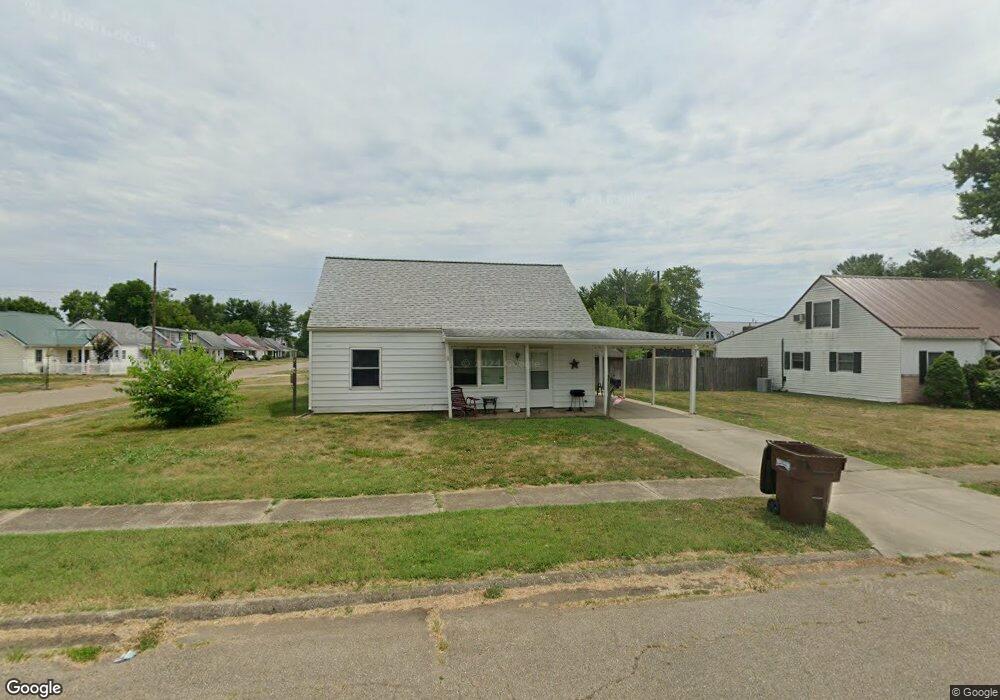
502 E 4th St Waverly, OH 45690
Estimated Value: $151,265 - $180,000
3
Beds
1
Bath
800
Sq Ft
$199/Sq Ft
Est. Value
About This Home
This home is located at 502 E 4th St, Waverly, OH 45690 and is currently estimated at $158,816, approximately $198 per square foot. 502 E 4th St is a home located in Pike County with nearby schools including Waverly Primary School, Waverly Intermediate School, and Waverly Junior High School.
Ownership History
Date
Name
Owned For
Owner Type
Purchase Details
Closed on
Nov 17, 2006
Sold by
Fairchild John W and Fairchild Diann K
Bought by
Taphoaro Ltd
Current Estimated Value
Home Financials for this Owner
Home Financials are based on the most recent Mortgage that was taken out on this home.
Original Mortgage
$52,000
Outstanding Balance
$31,086
Interest Rate
6.4%
Mortgage Type
Future Advance Clause Open End Mortgage
Estimated Equity
$127,730
Create a Home Valuation Report for This Property
The Home Valuation Report is an in-depth analysis detailing your home's value as well as a comparison with similar homes in the area
Home Values in the Area
Average Home Value in this Area
Purchase History
| Date | Buyer | Sale Price | Title Company |
|---|---|---|---|
| Taphoaro Ltd | $65,000 | None Available |
Source: Public Records
Mortgage History
| Date | Status | Borrower | Loan Amount |
|---|---|---|---|
| Open | Taphoaro Ltd | $52,000 |
Source: Public Records
Tax History
| Year | Tax Paid | Tax Assessment Tax Assessment Total Assessment is a certain percentage of the fair market value that is determined by local assessors to be the total taxable value of land and additions on the property. | Land | Improvement |
|---|---|---|---|---|
| 2024 | $1,459 | $38,680 | $9,380 | $29,300 |
| 2023 | $1,405 | $38,680 | $9,380 | $29,300 |
| 2022 | $893 | $21,360 | $5,870 | $15,490 |
| 2021 | $876 | $21,360 | $5,870 | $15,490 |
| 2020 | $877 | $21,360 | $5,870 | $15,490 |
| 2019 | $750 | $18,110 | $4,980 | $13,130 |
| 2018 | $722 | $18,110 | $4,980 | $13,130 |
| 2017 | $1,055 | $25,840 | $4,980 | $20,860 |
| 2016 | $695 | $16,400 | $3,650 | $12,750 |
| 2015 | $696 | $16,400 | $3,650 | $12,750 |
| 2014 | $674 | $16,400 | $3,650 | $12,750 |
| 2013 | $663 | $16,400 | $3,650 | $12,750 |
| 2012 | $679 | $16,400 | $3,650 | $12,750 |
Source: Public Records
Map
Nearby Homes
Your Personal Tour Guide
Ask me questions while you tour the home.