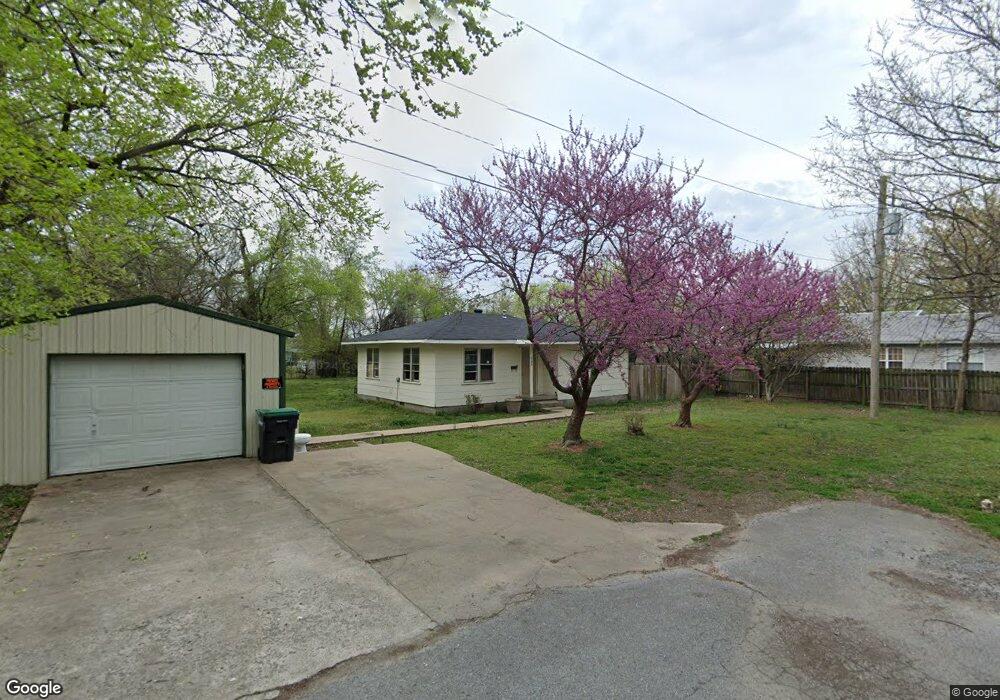
502 E Cherrie St Tahlequah, OK 74464
Estimated Value: $91,000 - $133,000
2
Beds
1
Bath
950
Sq Ft
$116/Sq Ft
Est. Value
About This Home
This home is located at 502 E Cherrie St, Tahlequah, OK 74464 and is currently estimated at $110,381, approximately $116 per square foot. 502 E Cherrie St is a home located in Cherokee County with nearby schools including Cherokee Elementary School, Greenwood Elementary School, and Tahlequah Middle School.
Ownership History
Date
Name
Owned For
Owner Type
Purchase Details
Closed on
Mar 23, 2022
Sold by
Cherokee County
Bought by
Waldrop Jeff and Waldrop Wyatt
Current Estimated Value
Purchase Details
Closed on
Jul 31, 2006
Sold by
Washington Stephanie
Bought by
Jones Vanessa B and Jones Rodney
Home Financials for this Owner
Home Financials are based on the most recent Mortgage that was taken out on this home.
Original Mortgage
$68,579
Interest Rate
6.62%
Mortgage Type
FHA
Purchase Details
Closed on
Dec 28, 2004
Sold by
Us Bank/Leader Mortgage
Bought by
Stephnie Washington
Purchase Details
Closed on
Jun 15, 2004
Sold by
Lindsay Best Colburn
Bought by
Leader Mortgage Co Llc
Purchase Details
Closed on
Jul 6, 2000
Sold by
Lindsay Best Now Colburn
Bought by
Lindsay and Colburn James E
Purchase Details
Closed on
Jul 26, 1999
Sold by
John J Beck
Bought by
Lindsay B Best
Purchase Details
Closed on
Jun 2, 1998
Sold by
Samuel S Chapman
Bought by
John J Beck
Create a Home Valuation Report for This Property
The Home Valuation Report is an in-depth analysis detailing your home's value as well as a comparison with similar homes in the area
Home Values in the Area
Average Home Value in this Area
Purchase History
| Date | Buyer | Sale Price | Title Company |
|---|---|---|---|
| Waldrop Jeff | -- | -- | |
| Jones Vanessa B | $69,500 | Tahlequah Abstract Closing S | |
| Stephnie Washington | $38,000 | -- | |
| Leader Mortgage Co Llc | -- | -- | |
| Lindsay | -- | -- | |
| Lindsay B Best | $54,500 | -- | |
| John J Beck | $50,500 | -- |
Source: Public Records
Mortgage History
| Date | Status | Borrower | Loan Amount |
|---|---|---|---|
| Previous Owner | Jones Vanessa B | $68,579 |
Source: Public Records
Tax History Compared to Growth
Tax History
| Year | Tax Paid | Tax Assessment Tax Assessment Total Assessment is a certain percentage of the fair market value that is determined by local assessors to be the total taxable value of land and additions on the property. | Land | Improvement |
|---|---|---|---|---|
| 2025 | $392 | $3,988 | $1,256 | $2,732 |
| 2024 | $392 | $4,133 | $1,256 | $2,877 |
| 2023 | $392 | $6,410 | $1,248 | $5,162 |
| 2022 | $595 | $6,410 | $1,248 | $5,162 |
| 2021 | $597 | $6,410 | $1,248 | $5,162 |
| 2020 | $608 | $6,410 | $1,248 | $5,162 |
| 2019 | $574 | $6,114 | $1,248 | $4,866 |
| 2018 | $554 | $5,823 | $1,248 | $4,575 |
| 2017 | $553 | $5,823 | $1,248 | $4,575 |
| 2016 | $556 | $5,823 | $1,248 | $4,575 |
| 2015 | $667 | $6,099 | $1,248 | $4,851 |
| 2014 | $667 | $7,081 | $1,265 | $5,816 |
Source: Public Records
Map
Nearby Homes
- 111 N Logan Dr
- 605 E Ward St
- 609 E Ward St
- 215 E Fuller St
- 103 S Harrison Ave
- 640 N Oklahoma Ave
- 104 Tommye Ln
- 215 S Maple Ave
- 200 Remington Place
- 717 N Oklahoma Ave
- 403 S Bluff Ave
- 707 Victor St
- 1025 E Downing St
- 605 S Oak Ave
- 0 S Hwy 82 A Hwy Unit 2532332
- 508 Covington Place
- 321 W Shawnee St
- 317 W Morgan St
- 720 S East Ave
- 201 Sandy Cir
- 204 N Ash Ave
- 206 N Ash Ave
- 501 E Cherrie St
- 213 N East Ave
- 501 E Shawnee St
- 503 E Shawnee St
- 207 N East Ave
- 418 E Shawnee Terrace
- 521 E Shawnee St
- 203 N East Ave
- 425 E Shawnee St
- 406 E Downing St
- 219 N East Ave
- 416 E Shawnee Terrace
- 216 N East Ave
- 200 N East Ave
- 202 N East Ave
- 208 N East Ave
- 212 N East Ave
- 613 E Cherrie St