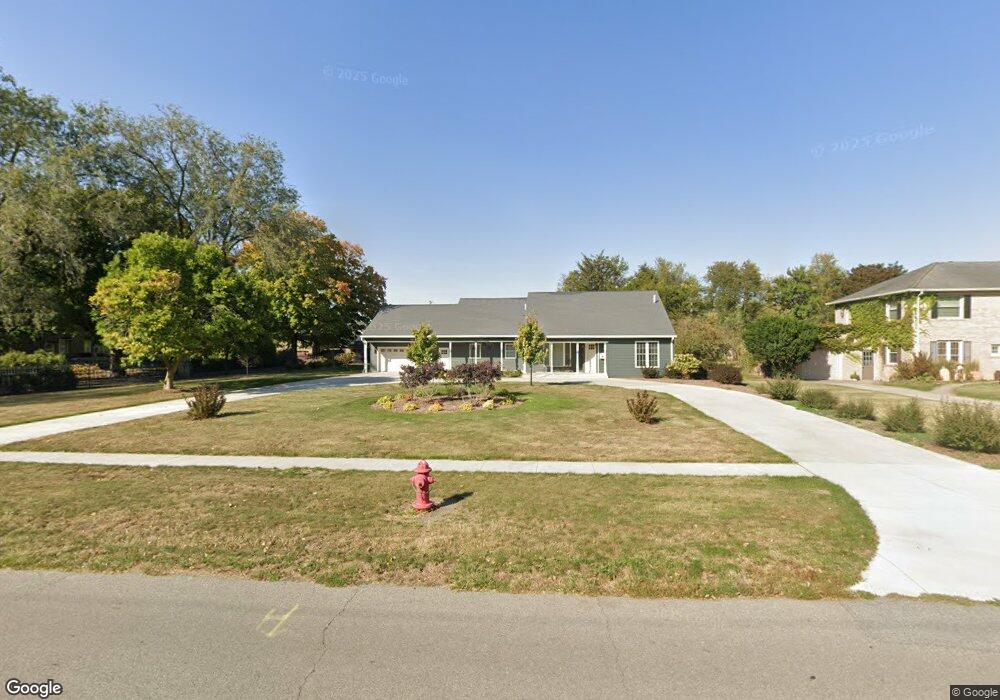
502 E Dunlap St Kentland, IN 47951
Estimated Value: $246,000 - $373,000
5
Beds
4
Baths
3,818
Sq Ft
$84/Sq Ft
Est. Value
About This Home
This home is located at 502 E Dunlap St, Kentland, IN 47951 and is currently estimated at $319,660, approximately $83 per square foot. 502 E Dunlap St is a home located in Newton County with nearby schools including South Newton Elementary School, South Newton Middle School, and South Newton Senior High School.
Ownership History
Date
Name
Owned For
Owner Type
Purchase Details
Closed on
Dec 20, 2018
Sold by
Davis Michael A
Bought by
Davis Garrett J
Current Estimated Value
Purchase Details
Closed on
Mar 31, 2017
Sold by
Wells N
Bought by
Davis Michael Augustus
Purchase Details
Closed on
Feb 9, 2017
Sold by
Parsons Joshua and Parsons Pamela
Bought by
Wells Fargo Bank Na
Purchase Details
Closed on
Mar 15, 2012
Sold by
Parsons Joshua
Bought by
Parsons Joshua and Parsons Pamela
Purchase Details
Closed on
Oct 15, 2010
Sold by
Kevin A Sorba
Bought by
Citifinancial Inc
Create a Home Valuation Report for This Property
The Home Valuation Report is an in-depth analysis detailing your home's value as well as a comparison with similar homes in the area
Home Values in the Area
Average Home Value in this Area
Purchase History
| Date | Buyer | Sale Price | Title Company |
|---|---|---|---|
| Davis Garrett J | -- | -- | |
| Davis Michael Augustus | $112,500 | -- | |
| Davis Michael A | $112,512 | -- | |
| Wells Fargo Bank Na | $112,500 | -- | |
| Parsons Joshua | -- | -- | |
| Citifinancial Inc | -- | Manley, Deas, Kochalski, Llc |
Source: Public Records
Tax History Compared to Growth
Tax History
| Year | Tax Paid | Tax Assessment Tax Assessment Total Assessment is a certain percentage of the fair market value that is determined by local assessors to be the total taxable value of land and additions on the property. | Land | Improvement |
|---|---|---|---|---|
| 2024 | $2,610 | $261,000 | $28,300 | $232,700 |
| 2023 | $2,512 | $251,200 | $28,300 | $222,900 |
| 2022 | $2,696 | $236,800 | $28,300 | $208,500 |
| 2021 | $1,617 | $161,700 | $24,400 | $137,300 |
| 2020 | $1,635 | $143,600 | $24,400 | $119,200 |
| 2019 | $1,632 | $143,600 | $24,400 | $119,200 |
| 2018 | $1,642 | $144,100 | $24,400 | $119,700 |
| 2017 | $1,708 | $148,600 | $20,600 | $128,000 |
| 2016 | $1,720 | $150,000 | $20,600 | $129,400 |
| 2014 | $1,438 | $147,200 | $20,600 | $126,600 |
| 2013 | $1,438 | $153,200 | $20,600 | $132,600 |
Source: Public Records
Map
Nearby Homes
- 407 N 7th St
- 408 E Graham St
- 405 N 7th St
- 407 N 3rd St
- 212 E Washington St
- 806 N 4th St
- 111 E Iroquois St
- 106 E Washington St
- 103 E Washington St
- 310 E Maple St
- 105 E Iroquois St
- 809 N 3rd St
- 101 W Lincoln St Unit 1
- 106 W Washington St
- 105 E Allen St
- Vacant Land W Allen St
- 218 W Allen St
- 323 W Graham St
- 311 W Allen St
- 315 W Railroad St