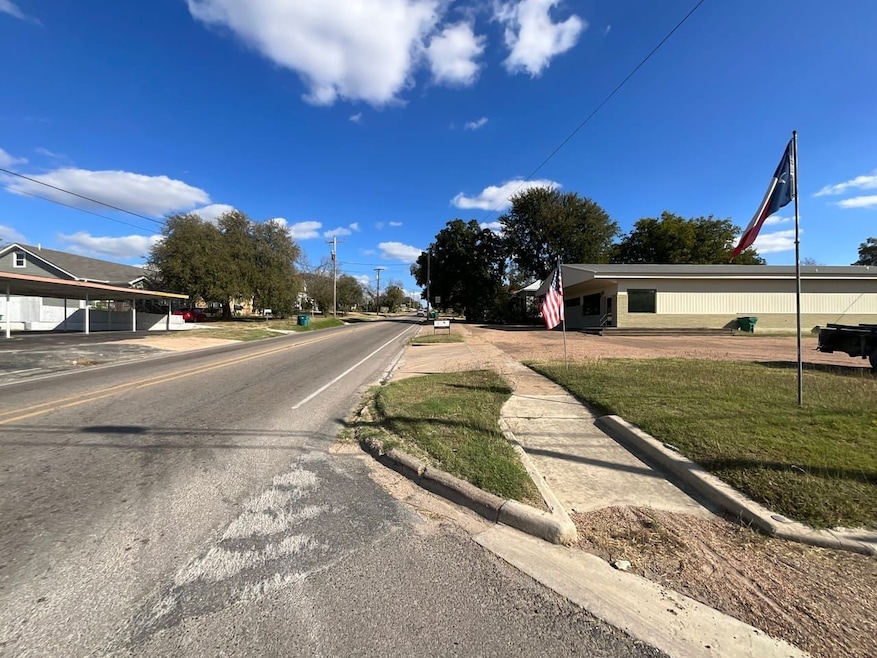
502 E Main Hamilton, TX 76531
About This Lot
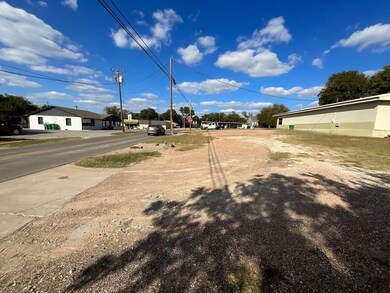
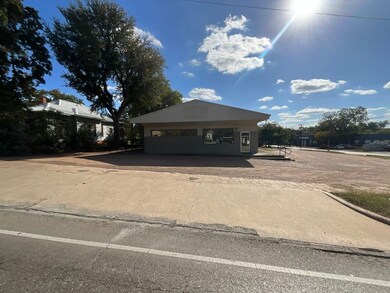
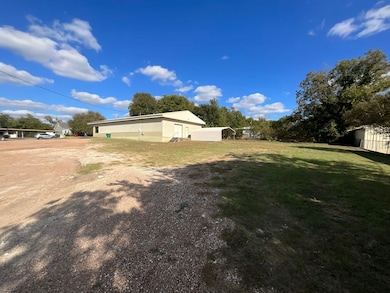
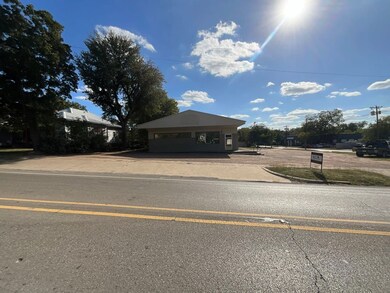
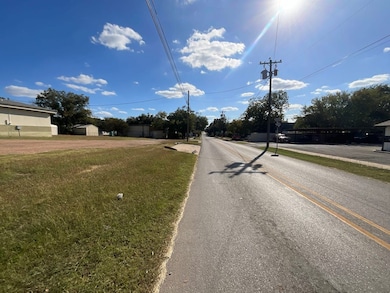
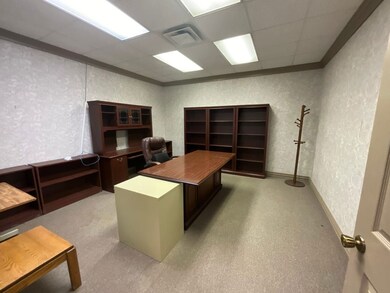
Office building with warehouse in a prime location in Hamilton Texas. This building sits at the corner of Main St and Reagan St and provides multiple access points from both streets. This metal building sits on approximately 1 acre and features 3200 sq ft under roof with 1400 sq ft of air conditioned office space and 1800 sq ft of warehouse space with roll up door and loading dock. The office has served as an attorney office for several years. It has a nice receptionist area up front, large private office, large file room or second office, small kitchen, bathroom, conference room and two utility closets. The warehouse has a bathroom, two small rooms and large open space. This could easily be finished out for more offices or multiple other uses. The building is metal sheeting with brick facade and large sidewalk entry that is ADA accessible. The parking lot is mostly paved with gravel but does have some green areas for landscaping.

Property Details
Property Type
- Land
Map
Home Values in the Area
Average Home Value in this Area
Tax History
| Year | Tax Paid | Tax Assessment Tax Assessment Total Assessment is a certain percentage of the fair market value that is determined by local assessors to be the total taxable value of land and additions on the property. | Land | Improvement |
|---|---|---|---|---|
| 2025 | $5,186 | $266,490 | $40,500 | $225,990 |
| 2024 | $4,536 | $253,940 | $40,500 | $213,440 |
| 2023 | $3,988 | $228,790 | $40,500 | $188,290 |
| 2022 | $4,182 | $217,000 | $40,500 | $176,500 |
| 2021 | $3,760 | $159,280 | $40,500 | $118,780 |
| 2020 | $2,890 | $121,220 | $40,500 | $80,720 |
| 2019 | $2,987 | $121,250 | $40,500 | $80,750 |
| 2018 | $2,740 | $113,190 | $40,500 | $72,690 |
| 2017 | $2,705 | $113,190 | $40,500 | $72,690 |
| 2016 | $2,649 | $113,190 | $40,500 | $72,690 |
| 2015 | -- | $113,190 | $40,500 | $72,690 |
| 2014 | -- | $113,190 | $40,500 | $72,690 |
Property History
| Date | Event | Price | List to Sale | Price per Sq Ft |
|---|---|---|---|---|
| 03/27/2026 03/27/26 | Pending | -- | -- | -- |
| 10/15/2025 10/15/25 | Price Changed | $259,000 | -9.1% | -- |
| 08/11/2025 08/11/25 | Price Changed | $285,000 | -3.4% | -- |
| 04/23/2025 04/23/25 | Price Changed | $295,000 | -4.5% | -- |
| 10/23/2024 10/23/24 | For Sale | $309,000 | -- | -- |
Purchase History
| Date | Type | Sale Price | Title Company |
|---|---|---|---|
| Grant Deed | $375,000 | -- |
Mortgage History
| Date | Status | Loan Amount | Loan Type |
|---|---|---|---|
| Open | $300,000 | New Conventional |
- 506 E Main St
- 601 E Henry St
- 609 E Henry St
- 110 S Bell St
- 407 S Reagan St
- 616 E Main St
- 422 County Rd
- 350 Pr 6191
- 10 Hamilton
- 117 N Rice St
- 720 E Leslie St
- 502 S Bell St
- 802 E Main St
- 222 Farm To Market 2905
- 522 E Standifer St
- 504 N Hall St
- 547 E Hill St
- 518 N Manning St
- 601 S Bell St
- 206 N Bouldin St
Ask me questions while you tour the home.