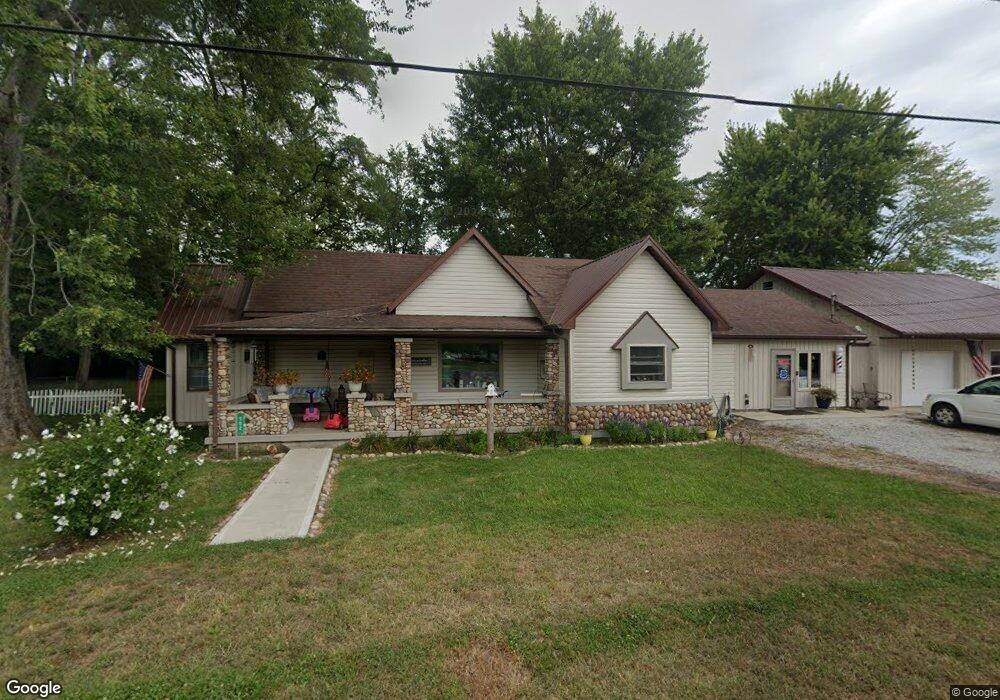
502 E Second St Carthage, IN 46115
Estimated Value: $158,000 - $183,704
2
Beds
2
Baths
1,981
Sq Ft
$85/Sq Ft
Est. Value
About This Home
This home is located at 502 E Second St, Carthage, IN 46115 and is currently estimated at $167,926, approximately $84 per square foot. 502 E Second St is a home located in Rush County with nearby schools including Knightstown Elementary School, Knightstown Intermediate School, and Knightstown High School.
Ownership History
Date
Name
Owned For
Owner Type
Purchase Details
Closed on
Feb 28, 2020
Sold by
Spence Larry
Bought by
Muncy Dennis and Muncy Sandra
Current Estimated Value
Purchase Details
Closed on
Apr 29, 2010
Sold by
Edwards Julie
Bought by
Us Bank Na Nd
Purchase Details
Closed on
Dec 20, 2005
Sold by
Fannie Mae
Bought by
Edwards Julie
Home Financials for this Owner
Home Financials are based on the most recent Mortgage that was taken out on this home.
Original Mortgage
$11,700
Interest Rate
6.46%
Mortgage Type
Stand Alone Second
Purchase Details
Closed on
Sep 26, 2005
Sold by
Countrywide Home Loans Inc
Bought by
Federal National Mortgage Association
Purchase Details
Closed on
Sep 20, 2005
Sold by
Geer Don L
Bought by
Countrywide Home Loans Inc
Create a Home Valuation Report for This Property
The Home Valuation Report is an in-depth analysis detailing your home's value as well as a comparison with similar homes in the area
Purchase History
| Date | Buyer | Sale Price | Title Company |
|---|---|---|---|
| Muncy Dennis | -- | None Available | |
| Us Bank Na Nd | -- | None Available | |
| Edwards Julie | -- | None Available | |
| Federal National Mortgage Association | -- | None Available | |
| Countrywide Home Loans Inc | -- | None Available |
Source: Public Records
Mortgage History
| Date | Status | Borrower | Loan Amount |
|---|---|---|---|
| Previous Owner | Edwards Julie | $11,700 |
Source: Public Records
Tax History
| Year | Tax Paid | Tax Assessment Tax Assessment Total Assessment is a certain percentage of the fair market value that is determined by local assessors to be the total taxable value of land and additions on the property. | Land | Improvement |
|---|---|---|---|---|
| 2025 | $393 | $136,000 | $14,000 | $122,000 |
| 2024 | $393 | $133,800 | $14,000 | $119,800 |
| 2023 | $217 | $124,900 | $14,000 | $110,900 |
| 2022 | $0 | $95,200 | $14,000 | $81,200 |
| 2021 | $26 | $64,100 | $14,000 | $50,100 |
| 2020 | $0 | $64,100 | $14,000 | $50,100 |
| 2019 | $1,312 | $64,100 | $14,000 | $50,100 |
| 2018 | $1,278 | $62,600 | $14,000 | $48,600 |
| 2017 | $1,269 | $62,100 | $14,000 | $48,100 |
| 2016 | $1,240 | $60,800 | $13,700 | $47,100 |
| 2014 | $1,162 | $58,000 | $13,300 | $44,700 |
| 2013 | $1,162 | $58,000 | $13,300 | $44,700 |
Source: Public Records
Map
Nearby Homes
- 308 Winters Way
- 4 W Henley St
- 11870 N 550 W
- 11020 W Us Highway 40
- 121 S Mccullum St
- 315 Blue River Dr
- 307 Blue River Dr
- 306 Blue River Dr
- 308 Blue River Dr
- 324 Blue River Dr
- 127 S Madison St
- 6121 U S 40
- 132 Southeast St
- 263 S Carthage Rd
- 225 S Carthage Rd
- 308 S West St
- 32 N Mccullum St
- 0 Indiana 109
- 131 S Jefferson St
- W County Road 500 S
- 502 E 2nd St
- 405-407 N Market St
- 504 E Second St
- 314 E Second St
- 501 E First St
- 501 E 1st St
- 405 E First St
- 106 N Harrison St
- 312 E First St
- 401 E First St
- 310 E First St
- 309 E Second St
- 207 N Winters Way
- 308 E First St
- 311 E First St
- 309 E 5th St
- 211 N Winters Way
- 308 E Second St
- 309 E First St
- 301 N Winters Way
Your Personal Tour Guide
Ask me questions while you tour the home.