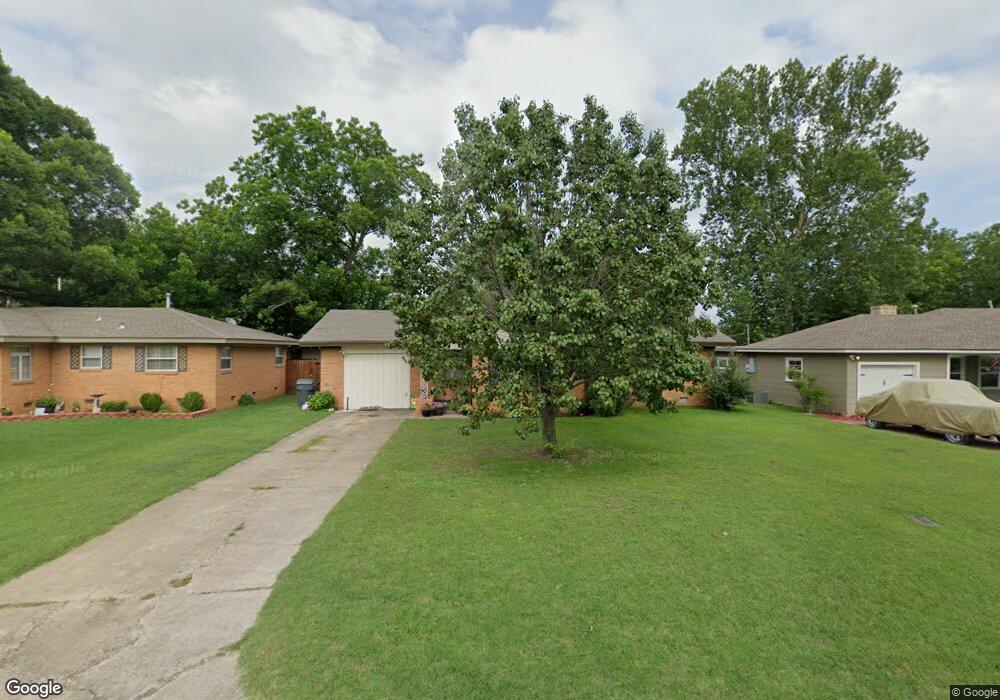
502 G St SW Ardmore, OK 73401
Estimated Value: $114,000 - $132,000
2
Beds
1
Bath
1,079
Sq Ft
$113/Sq Ft
Est. Value
About This Home
This home is located at 502 G St SW, Ardmore, OK 73401 and is currently estimated at $122,192, approximately $113 per square foot. 502 G St SW is a home located in Carter County with nearby schools including Lincoln Elementary School, Ardmore Middle School, and Ardmore High School.
Ownership History
Date
Name
Owned For
Owner Type
Purchase Details
Closed on
Jan 13, 2016
Sold by
Faustner Kenneth L and Fautner Janet L
Bought by
Caldwell Hannah
Current Estimated Value
Home Financials for this Owner
Home Financials are based on the most recent Mortgage that was taken out on this home.
Original Mortgage
$74,623
Outstanding Balance
$59,174
Interest Rate
3.87%
Mortgage Type
FHA
Estimated Equity
$63,018
Purchase Details
Closed on
Jul 25, 1997
Sold by
Sparks Richard
Bought by
Faustner Ken L and Faustner Jane
Create a Home Valuation Report for This Property
The Home Valuation Report is an in-depth analysis detailing your home's value as well as a comparison with similar homes in the area
Home Values in the Area
Average Home Value in this Area
Purchase History
| Date | Buyer | Sale Price | Title Company |
|---|---|---|---|
| Caldwell Hannah | $76,000 | None Available | |
| Faustner Ken L | $35,000 | -- |
Source: Public Records
Mortgage History
| Date | Status | Borrower | Loan Amount |
|---|---|---|---|
| Open | Caldwell Hannah | $74,623 |
Source: Public Records
Tax History Compared to Growth
Tax History
| Year | Tax Paid | Tax Assessment Tax Assessment Total Assessment is a certain percentage of the fair market value that is determined by local assessors to be the total taxable value of land and additions on the property. | Land | Improvement |
|---|---|---|---|---|
| 2024 | $1,084 | $10,978 | $1,800 | $9,178 |
| 2023 | $1,033 | $10,456 | $1,800 | $8,656 |
| 2022 | $952 | $9,958 | $1,800 | $8,158 |
| 2021 | $957 | $9,484 | $1,800 | $7,684 |
| 2020 | $898 | $9,032 | $2,040 | $6,992 |
| 2019 | $877 | $9,034 | $2,040 | $6,994 |
| 2018 | $892 | $9,035 | $2,040 | $6,995 |
| 2017 | $834 | $9,120 | $1,320 | $7,800 |
| 2016 | $476 | $5,111 | $903 | $4,208 |
| 2015 | $374 | $4,868 | $265 | $4,603 |
| 2014 | $356 | $4,635 | $265 | $4,370 |
Source: Public Records
Map
Nearby Homes