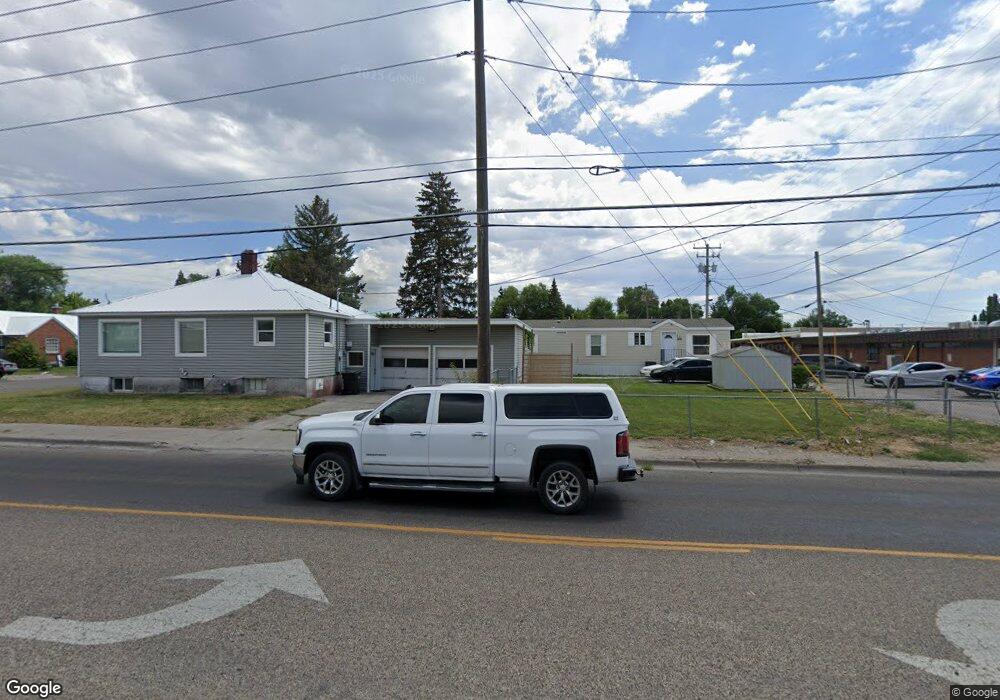
502 Gladstone St Idaho Falls, ID 83401
Estimated Value: $286,000 - $395,000
3
Beds
2
Baths
643
Sq Ft
$509/Sq Ft
Est. Value
About This Home
This home is located at 502 Gladstone St, Idaho Falls, ID 83401 and is currently estimated at $327,605, approximately $509 per square foot. 502 Gladstone St is a home located in Bonneville County with nearby schools including Dora Erickson Elementary School, Taylorview Middle School, and Idaho Falls Senior High School.
Ownership History
Date
Name
Owned For
Owner Type
Purchase Details
Closed on
Jun 29, 2021
Sold by
Metcalf Craig R
Bought by
Landon Colt L
Current Estimated Value
Home Financials for this Owner
Home Financials are based on the most recent Mortgage that was taken out on this home.
Original Mortgage
$337,000
Outstanding Balance
$205,595
Interest Rate
2.9%
Mortgage Type
Commercial
Estimated Equity
$122,010
Purchase Details
Closed on
Jun 8, 2017
Sold by
Smith Metcalf Mr Verle
Bought by
Metcalf Mr and Metcalf Craig R
Purchase Details
Closed on
Dec 30, 2015
Sold by
T A Rentals Llc
Bought by
Metcalf Verle Smith
Purchase Details
Closed on
May 28, 2009
Sold by
The Metcalf Family Trust
Bought by
T A Rentals Llc
Home Financials for this Owner
Home Financials are based on the most recent Mortgage that was taken out on this home.
Original Mortgage
$180,000
Interest Rate
4.8%
Mortgage Type
Purchase Money Mortgage
Create a Home Valuation Report for This Property
The Home Valuation Report is an in-depth analysis detailing your home's value as well as a comparison with similar homes in the area
Home Values in the Area
Average Home Value in this Area
Purchase History
| Date | Buyer | Sale Price | Title Company |
|---|---|---|---|
| Landon Colt L | -- | Titleone Twin Falls | |
| Metcalf Mr | -- | None Available | |
| Metcalf Verle Smith | $142,233 | First American Title Co | |
| T A Rentals Llc | -- | -- |
Source: Public Records
Mortgage History
| Date | Status | Borrower | Loan Amount |
|---|---|---|---|
| Open | Landon Colt L | $337,000 | |
| Previous Owner | T A Rentals Llc | $180,000 |
Source: Public Records
Tax History Compared to Growth
Tax History
| Year | Tax Paid | Tax Assessment Tax Assessment Total Assessment is a certain percentage of the fair market value that is determined by local assessors to be the total taxable value of land and additions on the property. | Land | Improvement |
|---|---|---|---|---|
| 2025 | $2,680 | $410,186 | $77,723 | $332,463 |
| 2024 | $2,680 | $317,146 | $53,618 | $263,528 |
| 2023 | $3,017 | $299,138 | $53,618 | $245,520 |
| 2022 | $3,309 | $258,137 | $45,037 | $213,100 |
| 2021 | $2,519 | $178,037 | $45,037 | $133,000 |
| 2019 | $2,687 | $153,902 | $37,522 | $116,380 |
| 2018 | $2,338 | $148,245 | $34,125 | $114,120 |
| 2017 | $2,160 | $122,055 | $24,775 | $97,280 |
| 2016 | $2,172 | $113,729 | $22,469 | $91,260 |
| 2015 | $2,149 | $112,789 | $22,469 | $90,320 |
| 2014 | $40,661 | $112,789 | $22,469 | $90,320 |
| 2013 | $1,779 | $95,575 | $22,468 | $73,107 |
Source: Public Records
Map
Nearby Homes
- 447 Cleveland St
- 375 N Freeman Ave
- 485 N Higbee Ave
- 425 2nd St
- 339 Gladstone St
- 3109 E 1st St
- 2313 E 1st St
- 400 College St
- 285 Lomax St
- 380 3rd St
- 242 Gladstone St
- 772 Cleveland St
- 445 5th St
- 798 Garfield St
- 220 N Fanning Ave Unit 9
- 220 N Fanning Ave Unit 15
- 110 Chatham Dr
- 195 2nd St
- TBD Cleveland St
- 446 6th St
- 504 Gladstone St
- 518 Gladstone St
- 506 Gladstone St
- 503 Gladstone St
- 519 Gladstone St
- 320 N Holmes Ave Unit 2
- 320 N Holmes Ave Unit 3
- 320 N Holmes Ave
- 522 Gladstone St
- 245 N Holmes Ave
- 532 Gladstone St
- 330 N Holmes Ave
- 545 Gladstone St
- 561 Gladstone St
- 325 N Holmes Ave
- 366 N Holmes Ave
- 203 N Holmes Ave
- 479 Lomax St
- 464 Gladstone St
- 542 Gladstone St