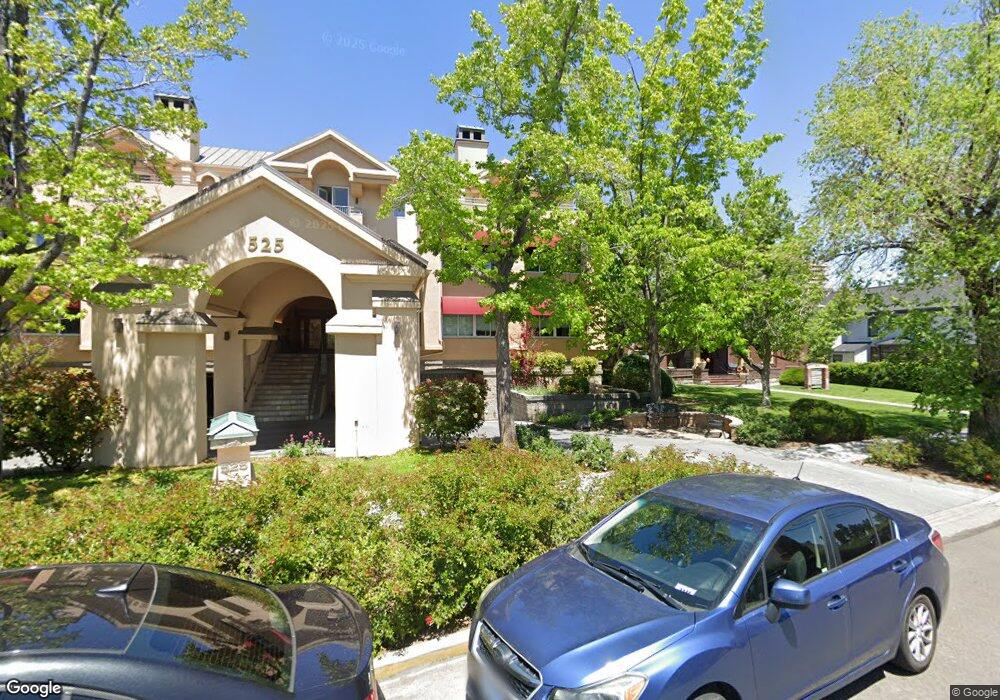
502 Island Ave Unit 1D Reno, NV 89501
MidTown NeighborhoodEstimated Value: $401,053 - $715,000
2
Beds
2
Baths
1,678
Sq Ft
$319/Sq Ft
Est. Value
About This Home
This home is located at 502 Island Ave Unit 1D, Reno, NV 89501 and is currently estimated at $535,513, approximately $319 per square foot. 502 Island Ave Unit 1D is a home located in Washoe County with nearby schools including Jessie Beck Elementary School, Darrell C Swope Middle School, and Reno High School.
Ownership History
Date
Name
Owned For
Owner Type
Purchase Details
Closed on
Mar 27, 2025
Sold by
Gerald And Frances Dorn Living Trust and Dorn Gerald H
Bought by
Gerald And Frances Dorn Living Trust and Dorn
Current Estimated Value
Purchase Details
Closed on
Feb 22, 2003
Sold by
Dorn Frances E
Bought by
Dorn Gerald H and Dorn Frances E
Purchase Details
Closed on
Jan 14, 2002
Sold by
Dorn Gerald
Bought by
Dorn Frances
Home Financials for this Owner
Home Financials are based on the most recent Mortgage that was taken out on this home.
Original Mortgage
$135,000
Interest Rate
6.84%
Purchase Details
Closed on
Dec 3, 1996
Sold by
Stone Harvey
Bought by
Boyer John E and The John E Boyer Trust
Purchase Details
Closed on
Aug 5, 1996
Sold by
Lewis John E
Bought by
Stone Harvey
Create a Home Valuation Report for This Property
The Home Valuation Report is an in-depth analysis detailing your home's value as well as a comparison with similar homes in the area
Home Values in the Area
Average Home Value in this Area
Purchase History
| Date | Buyer | Sale Price | Title Company |
|---|---|---|---|
| Gerald And Frances Dorn Living Trust | -- | None Listed On Document | |
| Dorn Gerald H | -- | -- | |
| Dorn Frances | $150,000 | Western Title Inc | |
| Dorn Frances | $150,000 | Western Title Inc | |
| Boyer John E | $139,000 | Stewart Title | |
| Stone Harvey | -- | -- |
Source: Public Records
Mortgage History
| Date | Status | Borrower | Loan Amount |
|---|---|---|---|
| Previous Owner | Dorn Frances | $135,000 |
Source: Public Records
Tax History Compared to Growth
Tax History
| Year | Tax Paid | Tax Assessment Tax Assessment Total Assessment is a certain percentage of the fair market value that is determined by local assessors to be the total taxable value of land and additions on the property. | Land | Improvement |
|---|---|---|---|---|
| 2025 | $1,647 | $54,157 | $27,720 | $26,437 |
| 2024 | $1,647 | $56,069 | $27,720 | $28,349 |
| 2023 | $1,599 | $52,322 | $26,355 | $25,967 |
| 2022 | $1,551 | $55,906 | $32,424 | $23,482 |
| 2021 | $1,508 | $48,026 | $23,772 | $24,254 |
| 2020 | $1,462 | $46,888 | $21,798 | $25,090 |
| 2019 | $1,419 | $46,157 | $20,790 | $25,367 |
| 2018 | $1,378 | $44,904 | $19,551 | $25,353 |
| 2017 | $1,338 | $45,346 | $19,551 | $25,795 |
| 2016 | $1,305 | $43,395 | $16,562 | $26,833 |
| 2015 | $1,302 | $39,261 | $12,740 | $26,521 |
| 2014 | $1,264 | $38,942 | $11,564 | $27,378 |
| 2013 | -- | $33,479 | $6,160 | $27,319 |
Source: Public Records
Map
Nearby Homes
- 280 Island Ave Unit 1602
- 280 Island Ave Unit 701
- 280 Island Ave Unit 906
- 280 Island Ave Unit 803
- 100 N Arlington Ave Unit 22G
- 100 N Arlington Ave Unit 21K
- 100 N Arlington Ave Unit 7B
- 100 N Arlington Ave Unit 10E
- 100 N Arlington Ave Unit 6G
- 100 N Arlington Ave Unit 20J
- 100 N Arlington Ave Unit 22C
- 100 N Arlington Ave Unit 7K
- 100 N Arlington Ave Unit 20E
- 100 N Arlington Ave Unit 22-H
- 100 N Arlington Ave Unit 17G
- 100 N Arlington Ave Unit 23-M
- 100 N Arlington Ave Unit 23P
- 100 N Arlington Ave Unit 6E
- 631 California Ave
- 0 Rainbow St
- 506 Island Ave Unit 2D
- 510 Island Ave
- 504 Island Ave
- 512 Island Ave
- 508 Island Ave
- 524 Island Ave Unit 3B
- 516 Island Ave
- 524 Island Ave
- 520 Island Ave Unit 2B
- 522 Island Ave Unit 3A
- 518 Island Ave
- 514 Island Ave
- 515 Court St
- 465 Court St
- 457 Court St
- 439 Court St
- 539 Riverside Dr
- 437 Court St
- 500 Court St
- 470 Court St