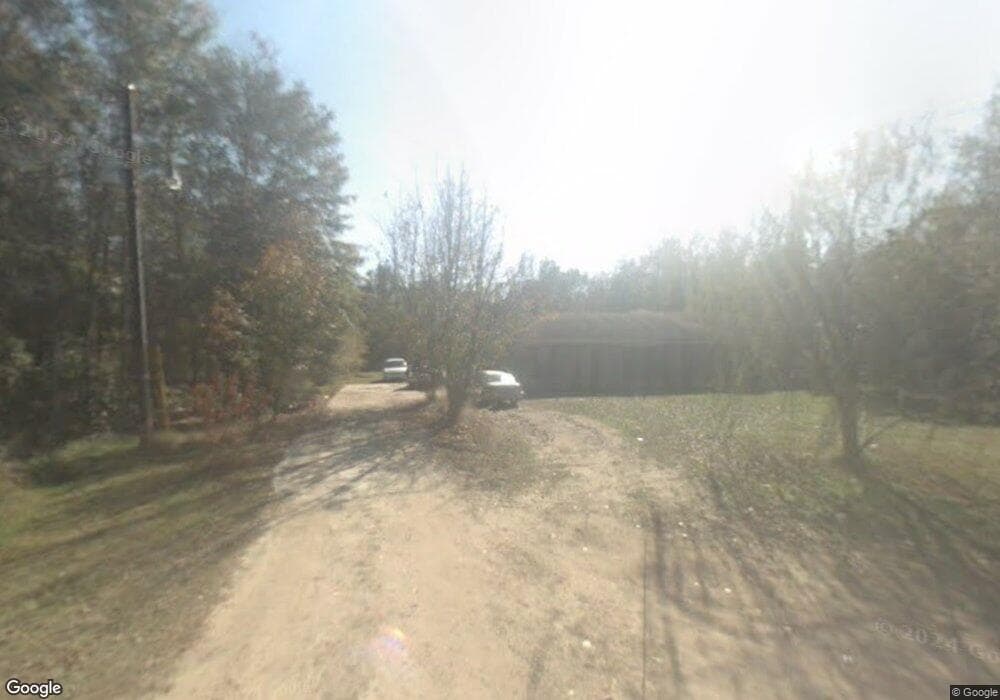
502 Ju Williams Ln Pembroke, GA 31321
Estimated Value: $294,000 - $438,000
3
Beds
2
Baths
1,769
Sq Ft
$198/Sq Ft
Est. Value
About This Home
This home is located at 502 Ju Williams Ln, Pembroke, GA 31321 and is currently estimated at $350,461, approximately $198 per square foot. 502 Ju Williams Ln is a home located in Bulloch County with nearby schools including Nevils Elementary School, Southeast Bulloch High School, and Southeast Bulloch Middle School.
Ownership History
Date
Name
Owned For
Owner Type
Purchase Details
Closed on
Nov 26, 2019
Sold by
Grant Terri
Bought by
Caldwell Corey Gene
Current Estimated Value
Home Financials for this Owner
Home Financials are based on the most recent Mortgage that was taken out on this home.
Original Mortgage
$116,500
Outstanding Balance
$71,776
Interest Rate
3.7%
Mortgage Type
New Conventional
Estimated Equity
$278,685
Purchase Details
Closed on
Oct 18, 2019
Sold by
Holcombe David Brian
Bought by
Grant Terri
Home Financials for this Owner
Home Financials are based on the most recent Mortgage that was taken out on this home.
Original Mortgage
$116,500
Outstanding Balance
$71,776
Interest Rate
3.7%
Mortgage Type
New Conventional
Estimated Equity
$278,685
Purchase Details
Closed on
Mar 31, 2017
Sold by
Grant Terri
Bought by
Holcombe David Brian and Holcombe Linda Faye
Home Financials for this Owner
Home Financials are based on the most recent Mortgage that was taken out on this home.
Original Mortgage
$129,000
Interest Rate
4.1%
Mortgage Type
New Conventional
Create a Home Valuation Report for This Property
The Home Valuation Report is an in-depth analysis detailing your home's value as well as a comparison with similar homes in the area
Home Values in the Area
Average Home Value in this Area
Purchase History
| Date | Buyer | Sale Price | Title Company |
|---|---|---|---|
| Caldwell Corey Gene | $126,500 | -- | |
| Grant Terri | -- | -- | |
| Holcombe David Brian | $129,000 | -- |
Source: Public Records
Mortgage History
| Date | Status | Borrower | Loan Amount |
|---|---|---|---|
| Open | Caldwell Corey Gene | $116,500 | |
| Previous Owner | Holcombe David Brian | $129,000 |
Source: Public Records
Tax History Compared to Growth
Tax History
| Year | Tax Paid | Tax Assessment Tax Assessment Total Assessment is a certain percentage of the fair market value that is determined by local assessors to be the total taxable value of land and additions on the property. | Land | Improvement |
|---|---|---|---|---|
| 2024 | $1,793 | $82,472 | $5,680 | $76,792 |
| 2023 | $1,778 | $75,080 | $4,560 | $70,520 |
| 2022 | $1,341 | $64,111 | $3,799 | $60,312 |
| 2021 | $1,172 | $54,943 | $3,799 | $51,144 |
| 2020 | $995 | $45,802 | $3,166 | $42,636 |
| 2019 | $1,256 | $54,999 | $3,166 | $51,833 |
| 2018 | $1,176 | $54,071 | $2,639 | $51,432 |
| 2017 | $1,197 | $51,946 | $2,639 | $49,307 |
| 2016 | $1,202 | $50,838 | $2,639 | $48,199 |
| 2015 | $1,178 | $49,565 | $2,639 | $46,926 |
| 2014 | $1,086 | $49,565 | $2,639 | $46,926 |
Source: Public Records
Map
Nearby Homes
- 232D Strickland Rd
- 1093 Lawrence Church Rd
- 0 Ash Branch Church Rd Unit SA341624
- 19963 Ga Highway 46
- 1014 Iler Rd
- 3309 Georgia 67
- 0 Floyd Rd Unit Lot 9 328851
- 0 Floyd Rd Unit Lot 7 328848
- 0 Floyd Rd Unit Lot 8 328847
- 0 Floyd Rd Unit LOT 9 10493980
- 0 Floyd Rd Unit LOT 8 10493967
- 0 Floyd Rd Unit LOT 7 10419354
- 21790 Ga Highway 46
- 0 Seed Tick Rd Unit 22261382
- 1278 Arthur Nuburn Rd
- 1278 Arthur Nuburn Jr Rd
- 1399 Wildwood Church Rd
- 0 New Town Rd Unit 10515043
- 313 Paul Smith Rd
- 0 Ig Lanier Rd Unit 11517688
- J Ju Williams Ln
- 349 Ju Williams Ln
- 348 Ju Williams Ln
- 0 Ju Williams Ln Unit 8051125
- 0 Ju Williams Ln
- 466 Ju Williams Ln
- 410 Mccoy Rd
- 3392 Lawrence Church Rd
- 441 Mccoy Rd
- 441 Mccoy Rd
- 0 Mccoy Rd Unit 20125191
- 0 Mccoy Rd Unit 288110
- 0 Mccoy Rd Unit 7367465
- 516 Mccoy Rd
- 184 Ju Williams Ln
- 3506 Lawrence Church Rd
- 299 Mccoy Rd
- 1201 Jim Futch Rd
- 3338 Lawrence Church Rd
- 120 Mccoy Rd