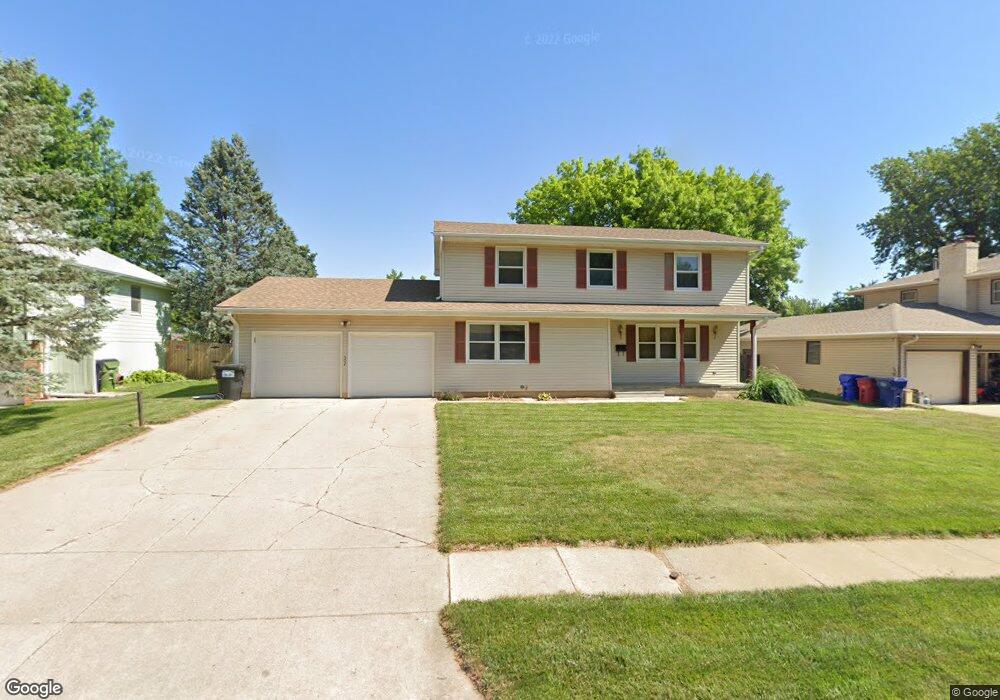
502 Matthies Dr Papillion, NE 68046
Estimated Value: $309,000 - $339,000
4
Beds
3
Baths
1,976
Sq Ft
$165/Sq Ft
Est. Value
About This Home
This home is located at 502 Matthies Dr, Papillion, NE 68046 and is currently estimated at $326,543, approximately $165 per square foot. 502 Matthies Dr is a home located in Sarpy County with nearby schools including Carriage Hill Elementary School, Papillion Middle School, and Papillion La Vista South High School.
Ownership History
Date
Name
Owned For
Owner Type
Purchase Details
Closed on
Sep 10, 2019
Sold by
Hanna Frank A and Hanna Ekine I
Bought by
Meisca Kimberly A
Current Estimated Value
Purchase Details
Closed on
Nov 29, 2001
Sold by
Meiser Kimberly A
Bought by
Meiser Kimberly A and Hanna Frank A
Home Financials for this Owner
Home Financials are based on the most recent Mortgage that was taken out on this home.
Original Mortgage
$138,500
Outstanding Balance
$54,200
Interest Rate
6.59%
Estimated Equity
$272,343
Purchase Details
Closed on
Dec 24, 1999
Sold by
Jensen James E and Jensen Debra A
Bought by
Meiser Kimberly A
Home Financials for this Owner
Home Financials are based on the most recent Mortgage that was taken out on this home.
Original Mortgage
$137,750
Interest Rate
7.69%
Create a Home Valuation Report for This Property
The Home Valuation Report is an in-depth analysis detailing your home's value as well as a comparison with similar homes in the area
Home Values in the Area
Average Home Value in this Area
Purchase History
| Date | Buyer | Sale Price | Title Company |
|---|---|---|---|
| Meisca Kimberly A | -- | None Available | |
| Meiser Kimberly A | -- | -- | |
| Meiser Kimberly A | $145,000 | -- |
Source: Public Records
Mortgage History
| Date | Status | Borrower | Loan Amount |
|---|---|---|---|
| Open | Meiser Kimberly A | $138,500 | |
| Closed | Meiser Kimberly A | $137,750 |
Source: Public Records
Tax History Compared to Growth
Tax History
| Year | Tax Paid | Tax Assessment Tax Assessment Total Assessment is a certain percentage of the fair market value that is determined by local assessors to be the total taxable value of land and additions on the property. | Land | Improvement |
|---|---|---|---|---|
| 2025 | $4,376 | $299,564 | $45,000 | $254,564 |
| 2024 | $5,281 | $295,236 | $40,000 | $255,236 |
| 2023 | $5,281 | $280,466 | $40,000 | $240,466 |
| 2022 | $5,079 | $248,908 | $35,000 | $213,908 |
| 2021 | $4,525 | $217,380 | $30,000 | $187,380 |
| 2020 | $4,233 | $201,305 | $29,000 | $172,305 |
| 2019 | $4,061 | $193,265 | $29,000 | $164,265 |
| 2018 | $4,079 | $191,159 | $22,000 | $169,159 |
| 2017 | $3,863 | $181,089 | $22,000 | $159,089 |
| 2016 | $3,621 | $170,010 | $22,000 | $148,010 |
| 2015 | $3,424 | $161,220 | $22,000 | $139,220 |
| 2014 | $3,568 | $166,838 | $22,000 | $144,838 |
| 2012 | -- | $166,923 | $22,000 | $144,923 |
Source: Public Records
Map
Nearby Homes
- 1118 S Grandview Ave
- 1126 Hackney Dr
- 1120 Delmar St Unit 4B
- 1111 Laport Dr
- 308 Crest Rd
- 704 Valley Rd
- 915 Arlene Cir
- Lot 52 Unit Lot 52
- 917 Arlene Cir
- Lot 289 Granite Lake
- LOT 293 Granite Lake
- 923 Arlene Cir
- 613 Valley Rd
- Lot 71 N Shore Commercial
- Lot 39
- 12378 Lake Vista Dr
- 262 Ashbury Hills St
- 259 Ashbury Hils St
- 235 Lot St
- Lot 28 Ashbury Hills
- 500 Matthies Dr
- 504 Matthies Dr
- 501 Crest Dr
- 503 Crest Dr
- 410 Matthies Dr
- 1101 Surrey Rd
- 411 Crest Dr
- 506 Matthies Dr
- 505 Crest Dr
- 1102 S Grandview Ave
- 408 Matthies Dr
- 409 Crest Dr
- 1102 Surrey Rd
- 1103 Surrey Rd
- 1104 S Grandview Ave
- 502 Crest Dr
- 1104 Surrey Rd
- 407 Crest Dr
- 406 Matthies Dr
- 601 Crest Dr