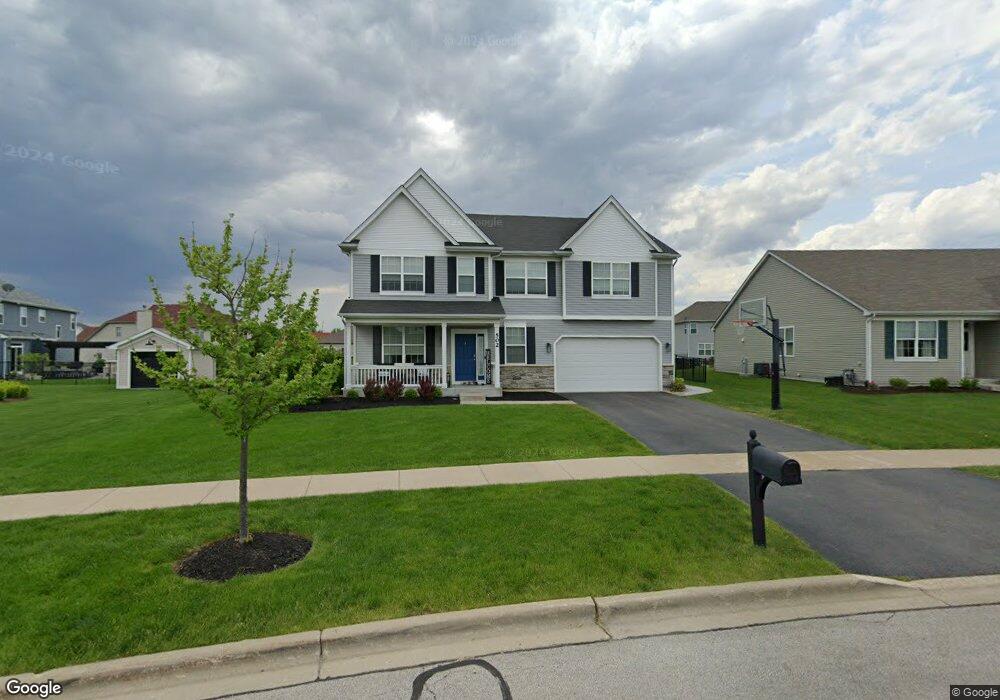
502 Moorfield Ave North Aurora, IL 60542
Estimated Value: $496,061 - $523,000
4
Beds
3
Baths
2,396
Sq Ft
$213/Sq Ft
Est. Value
About This Home
This home is located at 502 Moorfield Ave, North Aurora, IL 60542 and is currently estimated at $511,015, approximately $213 per square foot. 502 Moorfield Ave is a home located in Kane County with nearby schools including Fearn Elementary School, Jewel Middle School, and West Aurora High School.
Ownership History
Date
Name
Owned For
Owner Type
Purchase Details
Closed on
Sep 27, 2016
Sold by
K Hovnanian At Randall Highlands Llc
Bought by
Bertolini Daniel Joseph and Bertolini Bianca Michell
Current Estimated Value
Home Financials for this Owner
Home Financials are based on the most recent Mortgage that was taken out on this home.
Original Mortgage
$306,216
Outstanding Balance
$245,256
Interest Rate
3.43%
Mortgage Type
FHA
Estimated Equity
$265,759
Purchase Details
Closed on
Feb 20, 2015
Sold by
Mi Investments Ii Llc
Bought by
K Hovnanian At Randall Highlands Llc
Purchase Details
Closed on
Dec 3, 2009
Sold by
Sunset Hill Corporation
Bought by
Mi Investments Ii Llc
Purchase Details
Closed on
Jul 9, 2009
Sold by
Wiseman Hughes Enterprises Inc
Bought by
Sunset Hill Corporation
Create a Home Valuation Report for This Property
The Home Valuation Report is an in-depth analysis detailing your home's value as well as a comparison with similar homes in the area
Home Values in the Area
Average Home Value in this Area
Purchase History
| Date | Buyer | Sale Price | Title Company |
|---|---|---|---|
| Bertolini Daniel Joseph | $312,000 | Greater Illinois Title Co | |
| K Hovnanian At Randall Highlands Llc | $200,000 | None Available | |
| Mi Investments Ii Llc | $3,150,000 | Freedom Title Corp | |
| Sunset Hill Corporation | -- | Chicago Title Insurance Co |
Source: Public Records
Mortgage History
| Date | Status | Borrower | Loan Amount |
|---|---|---|---|
| Open | Bertolini Daniel Joseph | $306,216 |
Source: Public Records
Tax History Compared to Growth
Tax History
| Year | Tax Paid | Tax Assessment Tax Assessment Total Assessment is a certain percentage of the fair market value that is determined by local assessors to be the total taxable value of land and additions on the property. | Land | Improvement |
|---|---|---|---|---|
| 2024 | $10,069 | $141,949 | $25,478 | $116,471 |
| 2023 | $9,832 | $128,834 | $23,124 | $105,710 |
| 2022 | $9,454 | $120,405 | $21,611 | $98,794 |
| 2021 | $9,160 | $114,193 | $20,496 | $93,697 |
| 2020 | $9,130 | $111,998 | $20,102 | $91,896 |
| 2019 | $9,236 | $108,033 | $19,390 | $88,643 |
| 2018 | $9,165 | $103,917 | $18,651 | $85,266 |
| 2017 | $9,592 | $104,409 | $18,036 | $86,373 |
| 2016 | $3,846 | $39,817 | $17,511 | $22,306 |
| 2015 | -- | $9,723 | $9,723 | $0 |
| 2014 | -- | $9,417 | $9,417 | $0 |
| 2013 | -- | $9,233 | $9,233 | $0 |
Source: Public Records
Map
Nearby Homes
- 1432 Hartsburg Ln Unit 1
- 413 Messenger Cir
- 109 E Victoria Cir Unit 7/5
- 201 Hidden Creek Ln Unit 301
- 203 E Victoria Cir Unit 9/2
- 504 Dogwood Ct
- 1202 Fox Hill Ln Unit 362
- 791 Cottonwood Dr
- 316 E Victoria Cir Unit 125
- 438 Mallard Point Dr
- 442 Mallard Point Dr
- 1703 Breton Ave
- 22 Silver Trail Unit 2
- 727 Harmony Ct
- 71 Windstone Dr
- 523 Mallard Point Dr Unit 1
- 1655 Patterson Ave
- 1663 Patterson Ave
- 867 Fair Meadow Ct
- 875 Fair Meadow Ct
- 510 Moorfield Ave
- 1333 Ritter St
- 1320 Kilbery Ln
- 1341 Ritter St
- 1341 Ritter St Unit 40
- 1328 Kilbery Ln
- 518 Moorfield Ave
- 1312 Kilbery Ln
- 1349 Ritter St
- 501 Moorfield Ave
- 509 Moorfield Ave
- 1304 Kilbery Ln
- 526 Moorfield Ave
- 517 Moorfield Ave
- 1313 Kilbery (Site 15) Ln
- 1332 Ritter St
- 1340 Ritter St
- 1296 Kilbery Ln
- 534 Moorfield Ave
- 525 Moorfield Ave