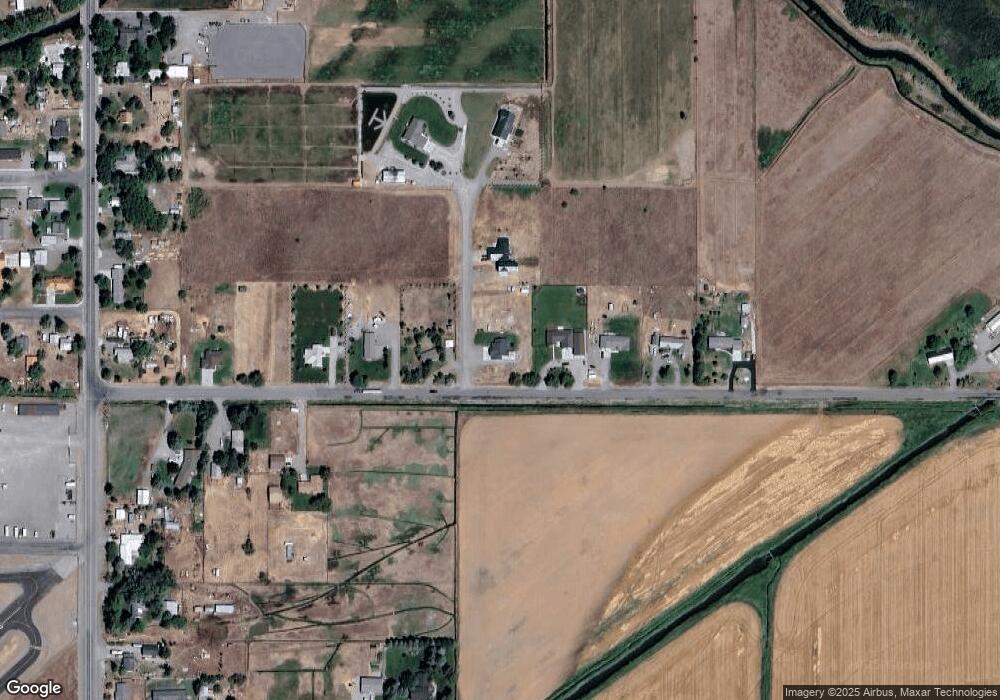
502 N 2420 E Saint Anthony, ID 83445
Estimated Value: $400,000 - $527,945
3
Beds
2
Baths
2,822
Sq Ft
$164/Sq Ft
Est. Value
About This Home
This home is located at 502 N 2420 E, Saint Anthony, ID 83445 and is currently estimated at $462,486, approximately $163 per square foot. 502 N 2420 E is a home with nearby schools including Henrys Fork Elementary School, South Fremont Junior High School, and South Fremont High School.
Ownership History
Date
Name
Owned For
Owner Type
Purchase Details
Closed on
Jul 2, 2021
Sold by
Granite Creek Rentals Llc
Bought by
Balls Ardell Jay and Balls Aerika
Current Estimated Value
Home Financials for this Owner
Home Financials are based on the most recent Mortgage that was taken out on this home.
Original Mortgage
$353,535
Outstanding Balance
$320,778
Interest Rate
2.9%
Mortgage Type
New Conventional
Estimated Equity
$141,708
Purchase Details
Closed on
May 24, 2021
Sold by
Robles Rance and Robles Summer
Bought by
Granite Creek Rentals Llc
Home Financials for this Owner
Home Financials are based on the most recent Mortgage that was taken out on this home.
Original Mortgage
$353,535
Outstanding Balance
$320,778
Interest Rate
2.9%
Mortgage Type
New Conventional
Estimated Equity
$141,708
Purchase Details
Closed on
Apr 18, 2016
Sold by
Chandler Craig and Chandler Deanna
Bought by
Robles Rance and Robles Summer
Create a Home Valuation Report for This Property
The Home Valuation Report is an in-depth analysis detailing your home's value as well as a comparison with similar homes in the area
Home Values in the Area
Average Home Value in this Area
Purchase History
| Date | Buyer | Sale Price | Title Company |
|---|---|---|---|
| Balls Ardell Jay | -- | Alliance Ttl Id Falls Office | |
| Granite Creek Rentals Llc | -- | Alliance Ttl Rexburg Office | |
| Robles Rance | -- | First American Title |
Source: Public Records
Mortgage History
| Date | Status | Borrower | Loan Amount |
|---|---|---|---|
| Open | Balls Ardell Jay | $353,535 |
Source: Public Records
Tax History Compared to Growth
Tax History
| Year | Tax Paid | Tax Assessment Tax Assessment Total Assessment is a certain percentage of the fair market value that is determined by local assessors to be the total taxable value of land and additions on the property. | Land | Improvement |
|---|---|---|---|---|
| 2025 | $2,092 | $477,939 | $51,000 | $426,939 |
| 2024 | $2,092 | $467,774 | $51,000 | $416,774 |
| 2023 | $1,925 | $409,526 | $41,000 | $368,526 |
| 2022 | $2,214 | $337,619 | $41,000 | $296,619 |
| 2021 | $985 | $99,783 | $18,000 | $81,783 |
| 2020 | $1,002 | $95,288 | $18,000 | $77,288 |
| 2019 | $993 | $95,288 | $18,000 | $77,288 |
| 2018 | $1,007 | $91,693 | $18,000 | $73,693 |
| 2017 | $2 | $11,640 | $11,640 | $0 |
| 2016 | $392 | $11,640 | $11,640 | $0 |
| 2015 | $103 | $11,640 | $0 | $0 |
| 2014 | $118 | $13,580 | $0 | $0 |
| 2013 | $118 | $13,580 | $0 | $0 |
Source: Public Records
Map
Nearby Homes