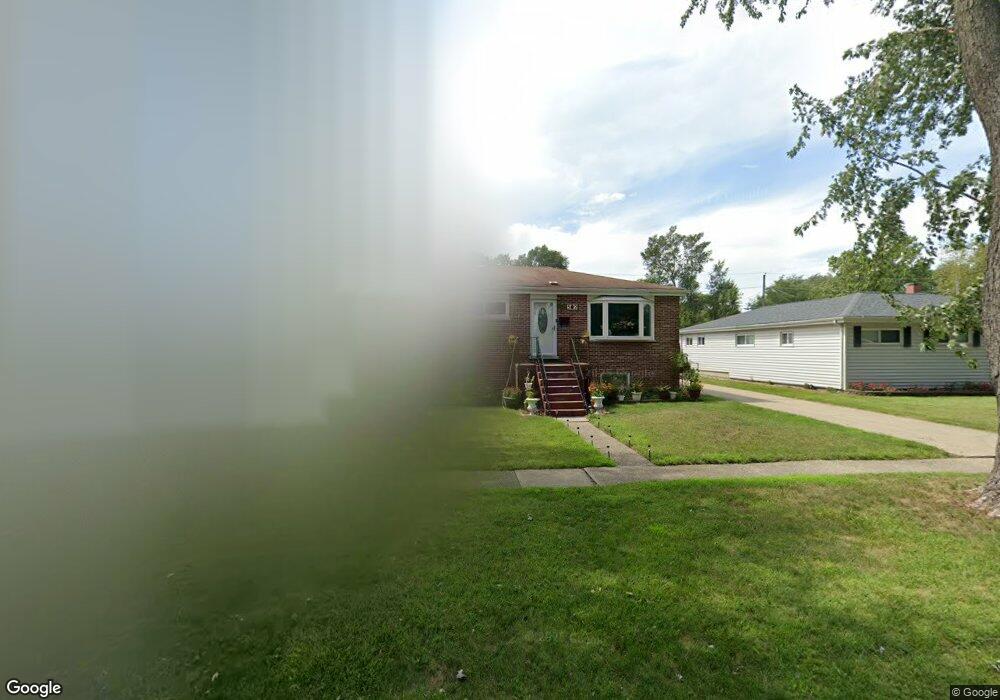
502 N 3rd Ave Villa Park, IL 60181
Estimated Value: $323,309 - $358,000
--
Bed
--
Bath
1,073
Sq Ft
$322/Sq Ft
Est. Value
About This Home
This home is located at 502 N 3rd Ave, Villa Park, IL 60181 and is currently estimated at $345,577, approximately $322 per square foot. 502 N 3rd Ave is a home located in DuPage County with nearby schools including Schafer Elementary School, Jefferson Middle School, and Willowbrook High School.
Ownership History
Date
Name
Owned For
Owner Type
Purchase Details
Closed on
Jan 13, 2009
Sold by
Pereira Emilia and Pereira Trevor
Bought by
Pereira Emilia
Current Estimated Value
Home Financials for this Owner
Home Financials are based on the most recent Mortgage that was taken out on this home.
Original Mortgage
$262,591
Outstanding Balance
$164,913
Interest Rate
5.06%
Mortgage Type
FHA
Estimated Equity
$180,664
Purchase Details
Closed on
Jul 24, 2002
Sold by
Fuentes Servando N and Fuentes Emilia
Bought by
Fuentes Emilia
Home Financials for this Owner
Home Financials are based on the most recent Mortgage that was taken out on this home.
Original Mortgage
$140,000
Interest Rate
6.64%
Purchase Details
Closed on
Mar 20, 1996
Sold by
Stankus Brian G and Stankus Lisa L
Bought by
Fuentes Servando N and Fernandes Emilia
Home Financials for this Owner
Home Financials are based on the most recent Mortgage that was taken out on this home.
Original Mortgage
$122,350
Interest Rate
7.06%
Create a Home Valuation Report for This Property
The Home Valuation Report is an in-depth analysis detailing your home's value as well as a comparison with similar homes in the area
Home Values in the Area
Average Home Value in this Area
Purchase History
| Date | Buyer | Sale Price | Title Company |
|---|---|---|---|
| Pereira Emilia | -- | Stewart Title Company | |
| Fuentes Emilia | -- | Stewart Title Company | |
| Fuentes Servando N | $133,000 | -- |
Source: Public Records
Mortgage History
| Date | Status | Borrower | Loan Amount |
|---|---|---|---|
| Open | Pereira Emilia | $262,591 | |
| Closed | Fuentes Emilia | $140,000 | |
| Closed | Fuentes Servando N | $122,350 |
Source: Public Records
Tax History Compared to Growth
Tax History
| Year | Tax Paid | Tax Assessment Tax Assessment Total Assessment is a certain percentage of the fair market value that is determined by local assessors to be the total taxable value of land and additions on the property. | Land | Improvement |
|---|---|---|---|---|
| 2024 | $6,562 | $94,817 | $13,009 | $81,808 |
| 2023 | $6,239 | $87,680 | $12,030 | $75,650 |
| 2022 | $6,086 | $84,280 | $11,560 | $72,720 |
| 2021 | $5,836 | $82,180 | $11,270 | $70,910 |
| 2020 | $5,695 | $80,380 | $11,020 | $69,360 |
| 2019 | $5,313 | $76,420 | $10,480 | $65,940 |
| 2018 | $4,949 | $67,610 | $9,270 | $58,340 |
| 2017 | $4,823 | $64,420 | $8,830 | $55,590 |
| 2016 | $4,680 | $60,690 | $8,320 | $52,370 |
| 2015 | $4,604 | $56,540 | $7,750 | $48,790 |
| 2014 | $5,573 | $67,420 | $15,460 | $51,960 |
| 2013 | $5,313 | $68,370 | $15,680 | $52,690 |
Source: Public Records
Map
Nearby Homes
- 417 W Terrace St
- 700 W Pleasant St
- 439 N Harvard Ave
- 739 N 2nd Ave
- 434 N Lincoln Ave
- 37 N Addison Rd
- 131 N Chase Ave
- 2N152 Wisconsin Ave
- 912 E Saint Charles Rd
- 247 N Ardmore Ave
- 935 E Saint Charles Rd
- 235 N Ardmore Ave
- 490 N Chatham Ave
- 933 W North Ave Unit A
- 937 W North Ave Unit C
- 736 E Saint Charles Rd
- 1136 E Kenilworth Ave
- 117 E Vermont St
- 2N000 Vista Ave
- 439 N Fairfield Ave