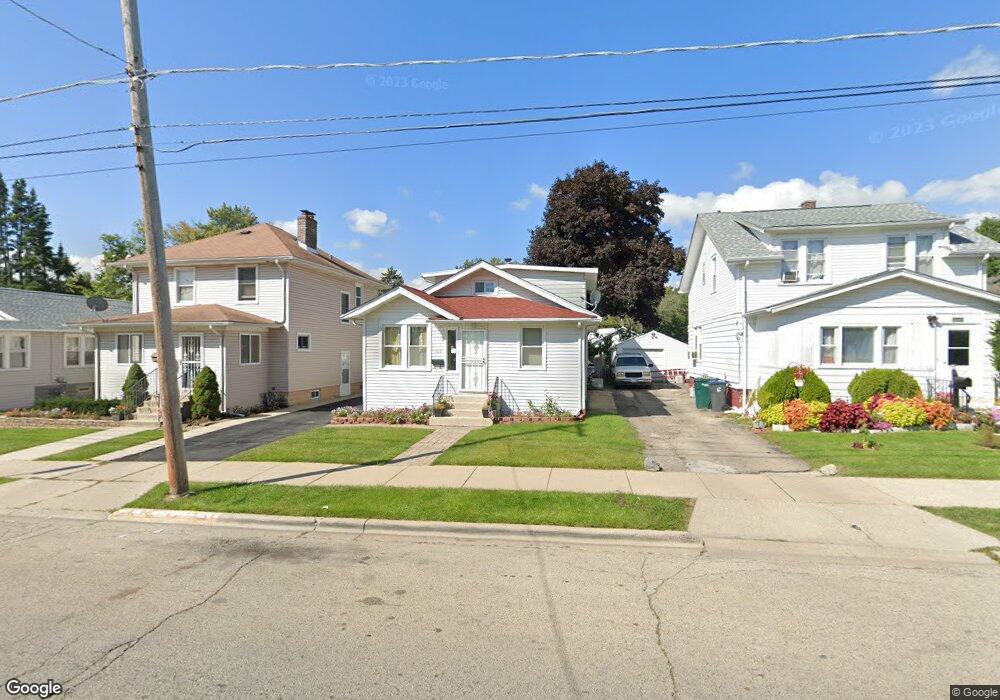
502 N Butrick St Waukegan, IL 60085
Pine Trail Estates NeighborhoodEstimated Value: $229,000 - $277,000
4
Beds
2
Baths
1,560
Sq Ft
$156/Sq Ft
Est. Value
About This Home
This home is located at 502 N Butrick St, Waukegan, IL 60085 and is currently estimated at $243,834, approximately $156 per square foot. 502 N Butrick St is a home located in Lake County with nearby schools including Hyde Park Elementary School, Miguel Juarez Middle School, and Waukegan High School.
Ownership History
Date
Name
Owned For
Owner Type
Purchase Details
Closed on
Jan 7, 2011
Sold by
Handy Herbert
Bought by
Garcia Samuel A and Chavez Senia Y
Current Estimated Value
Home Financials for this Owner
Home Financials are based on the most recent Mortgage that was taken out on this home.
Original Mortgage
$107,211
Outstanding Balance
$72,988
Interest Rate
4.75%
Mortgage Type
FHA
Estimated Equity
$170,846
Purchase Details
Closed on
Jun 22, 2010
Sold by
Citimortgage Inc
Bought by
Handy Herbert
Purchase Details
Closed on
Jun 4, 2010
Sold by
Coburn Albert L and Case #09 Ch 2594
Bought by
Citimortgage Inc
Purchase Details
Closed on
Jul 20, 2004
Sold by
Vaca Javier H
Bought by
Coburn Albert L and Coburn Gloria M
Home Financials for this Owner
Home Financials are based on the most recent Mortgage that was taken out on this home.
Original Mortgage
$111,900
Interest Rate
6.87%
Mortgage Type
Stand Alone First
Create a Home Valuation Report for This Property
The Home Valuation Report is an in-depth analysis detailing your home's value as well as a comparison with similar homes in the area
Home Values in the Area
Average Home Value in this Area
Purchase History
| Date | Buyer | Sale Price | Title Company |
|---|---|---|---|
| Garcia Samuel A | $110,000 | Fidelity National Title | |
| Handy Herbert | $40,000 | First American Title | |
| Citimortgage Inc | -- | First American Title | |
| Coburn Albert L | $145,000 | Matc |
Source: Public Records
Mortgage History
| Date | Status | Borrower | Loan Amount |
|---|---|---|---|
| Open | Garcia Samuel A | $107,211 | |
| Previous Owner | Coburn Albert L | $111,900 | |
| Closed | Coburn Albert L | $28,000 |
Source: Public Records
Tax History Compared to Growth
Tax History
| Year | Tax Paid | Tax Assessment Tax Assessment Total Assessment is a certain percentage of the fair market value that is determined by local assessors to be the total taxable value of land and additions on the property. | Land | Improvement |
|---|---|---|---|---|
| 2024 | $4,231 | $59,048 | $6,601 | $52,447 |
| 2023 | $3,748 | $52,866 | $5,910 | $46,956 |
| 2022 | $3,748 | $44,342 | $5,388 | $38,954 |
| 2021 | $3,527 | $39,832 | $5,076 | $34,756 |
| 2020 | $3,526 | $37,108 | $4,729 | $32,379 |
| 2019 | $3,496 | $34,003 | $4,333 | $29,670 |
| 2018 | $2,719 | $27,414 | $5,109 | $22,305 |
| 2017 | $2,597 | $24,254 | $4,520 | $19,734 |
| 2016 | $2,330 | $21,076 | $3,928 | $17,148 |
| 2015 | $2,173 | $18,864 | $3,516 | $15,348 |
| 2014 | $2,953 | $22,993 | $3,577 | $19,416 |
| 2012 | $3,880 | $24,911 | $3,876 | $21,035 |
Source: Public Records
Map
Nearby Homes
- 824 N Butrick St
- 1109 Massena Ave
- 511 Chestnut St
- 428 N Poplar St
- 522 N Poplar St
- 1416 Hamilton Ct
- 702 Franklin St
- 620 N Poplar St
- 917 N Linden Ave
- 1213 Grand Ave
- 1000 Pine St
- 23 N Jackson St
- 968 Judge Ave
- 2115 Lydia St
- 28 N Saint James St
- 615 Tiffany Dr
- 452 North Ave
- 1005 N Lewis Ave
- 1023 N Elmwood Ave
- 918 N Ash St
- 442 N Butrick St
- 506 N Butrick St
- 438 N Butrick St
- 510 N Butrick St
- 512 N Butrick St
- 503 Yeoman St
- 505 Yeoman St
- 434 N Butrick St
- 501 Yeoman St
- 507 Yeoman St
- 514 N Butrick St
- 503 N Butrick St
- 507 N Butrick St
- 430 N Butrick St
- 515 Yeoman St
- 511 N Butrick St
- 495 N Yeoman St
- 513 N Butrick St
- 426 N Butrick St
- 524 N Butrick St