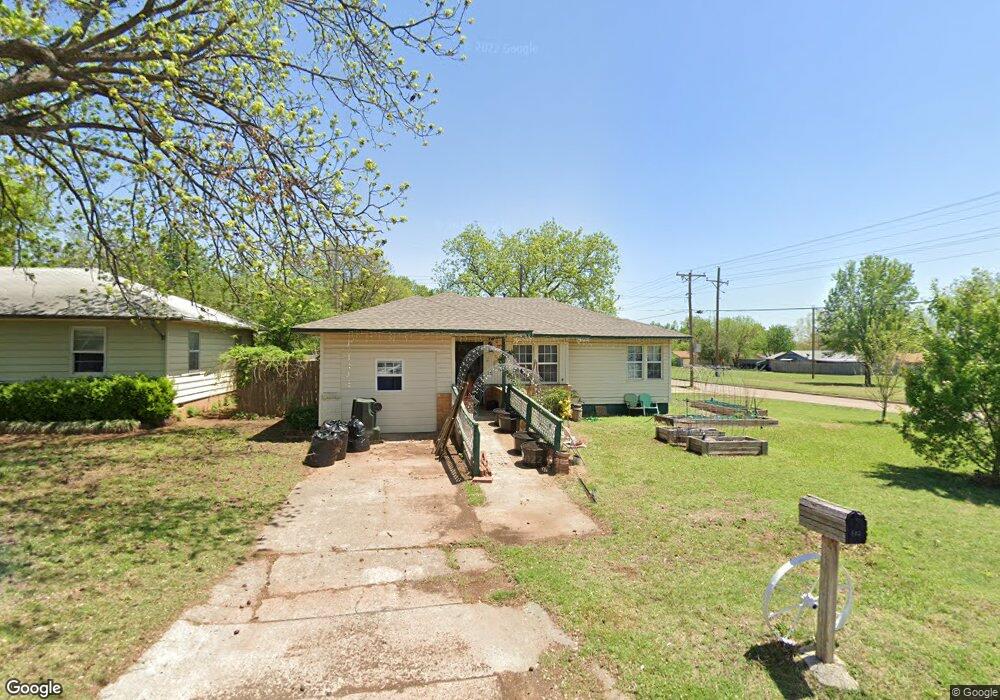
502 N H St Duncan, OK 73533
Estimated Value: $59,000 - $70,000
2
Beds
1
Bath
1,366
Sq Ft
$46/Sq Ft
Est. Value
About This Home
This home is located at 502 N H St, Duncan, OK 73533 and is currently estimated at $63,357, approximately $46 per square foot. 502 N H St is a home located in Stephens County with nearby schools including Woodrow Wilson Elementary School, Duncan Middle School, and Duncan High School.
Ownership History
Date
Name
Owned For
Owner Type
Purchase Details
Closed on
May 9, 2007
Sold by
Crow David S and Crow Billie L
Bought by
Hekia Brian K and Hekia Kassie S
Current Estimated Value
Home Financials for this Owner
Home Financials are based on the most recent Mortgage that was taken out on this home.
Original Mortgage
$62,056
Outstanding Balance
$37,479
Interest Rate
6.13%
Mortgage Type
VA
Estimated Equity
$25,878
Purchase Details
Closed on
Sep 2, 2005
Sold by
Harvey Christine
Bought by
Crow David S and Crow Billie L
Purchase Details
Closed on
Sep 15, 1999
Sold by
Young Charlie Mae
Create a Home Valuation Report for This Property
The Home Valuation Report is an in-depth analysis detailing your home's value as well as a comparison with similar homes in the area
Home Values in the Area
Average Home Value in this Area
Purchase History
| Date | Buyer | Sale Price | Title Company |
|---|---|---|---|
| Hekia Brian K | $61,500 | None Available | |
| Crow David S | $49,000 | None Available | |
| -- | $29,500 | -- |
Source: Public Records
Mortgage History
| Date | Status | Borrower | Loan Amount |
|---|---|---|---|
| Open | Hekia Brian K | $62,056 |
Source: Public Records
Tax History Compared to Growth
Tax History
| Year | Tax Paid | Tax Assessment Tax Assessment Total Assessment is a certain percentage of the fair market value that is determined by local assessors to be the total taxable value of land and additions on the property. | Land | Improvement |
|---|---|---|---|---|
| 2025 | $421 | $4,991 | $578 | $4,413 |
| 2024 | $405 | $4,754 | $578 | $4,176 |
| 2023 | $405 | $4,754 | $578 | $4,176 |
| 2022 | $367 | $4,312 | $578 | $3,734 |
| 2021 | $407 | $4,790 | $578 | $4,212 |
| 2020 | $449 | $5,203 | $578 | $4,625 |
| 2019 | $429 | $4,955 | $578 | $4,377 |
| 2018 | $420 | $4,955 | $578 | $4,377 |
| 2017 | $386 | $4,495 | $578 | $3,917 |
| 2016 | $544 | $6,398 | $578 | $5,820 |
| 2015 | $596 | $6,398 | $578 | $5,820 |
| 2014 | $596 | $6,398 | $578 | $5,820 |
Source: Public Records
Map
Nearby Homes