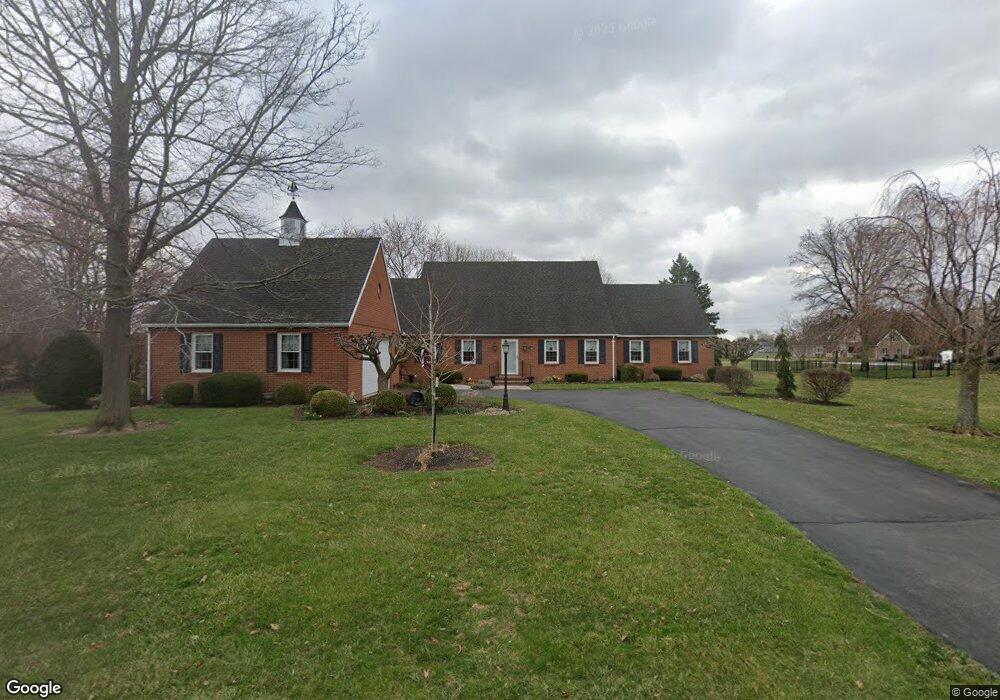
502 N High St Pandora, OH 45877
Estimated Value: $306,000 - $515,000
4
Beds
4
Baths
4,250
Sq Ft
$96/Sq Ft
Est. Value
About This Home
This home is located at 502 N High St, Pandora, OH 45877 and is currently estimated at $407,123, approximately $95 per square foot. 502 N High St is a home located in Putnam County with nearby schools including Pandora-Gilboa Elementary School, Pandora-Gilboa Middle School, and Pandora-Gilboa High School.
Create a Home Valuation Report for This Property
The Home Valuation Report is an in-depth analysis detailing your home's value as well as a comparison with similar homes in the area
Home Values in the Area
Average Home Value in this Area
Tax History Compared to Growth
Tax History
| Year | Tax Paid | Tax Assessment Tax Assessment Total Assessment is a certain percentage of the fair market value that is determined by local assessors to be the total taxable value of land and additions on the property. | Land | Improvement |
|---|---|---|---|---|
| 2024 | $3,792 | $147,540 | $11,210 | $136,330 |
| 2023 | $3,925 | $113,110 | $5,860 | $107,250 |
| 2022 | $3,878 | $113,110 | $5,859 | $107,251 |
| 2021 | $3,885 | $113,110 | $5,859 | $107,251 |
| 2020 | $3,879 | $99,900 | $5,350 | $94,550 |
| 2019 | $3,398 | $103,360 | $5,860 | $97,500 |
| 2018 | $3,381 | $103,360 | $5,860 | $97,500 |
| 2017 | $3,052 | $103,360 | $5,860 | $97,500 |
| 2016 | $3,052 | $99,900 | $5,350 | $94,550 |
| 2015 | $3,084 | $99,900 | $5,350 | $94,550 |
| 2014 | $3,021 | $99,900 | $5,350 | $94,550 |
| 2013 | $2,798 | $99,900 | $5,350 | $94,550 |
Source: Public Records
Map
Nearby Homes
- 101 Maplewood Dr
- 208 E Monroe St
- 17429 Road 5
- 10755 Bixel Rd
- 349 Sycamore Ct
- 8160 Columbus Grove-Bluffton Rd
- 110 Magnolia Ln
- 182 Sunset Dr
- 152 Chestnut Ln
- 0 Columbus Grove-Bluffton Rd
- 11242 Ottawa Dr
- 222 Grove St
- 212 S Lawn Ave
- 222 N Lawn Ave
- 217 Grove St
- 210 N Jackson St
- 106 Riley St
- 513 S Jackson St
- 307 Parkview Dr
- 305 Parkview Dr
- 501 N High St
- 504 N High St
- 503 N High St
- 410 N High St
- 413 N High St
- 501 Hawthorne Dr
- 505 N High St
- 502 N Jefferson St
- 506 N High St
- 504 N Jefferson St
- 411 N High St
- 506 N Jefferson St
- 506 N Jefferson St
- 408 N High St
- 412 N Jefferson St
- 507 N High St
- 409 N High St
- 408 N Jefferson St
- 510 N High St
- 508 N Jefferson St