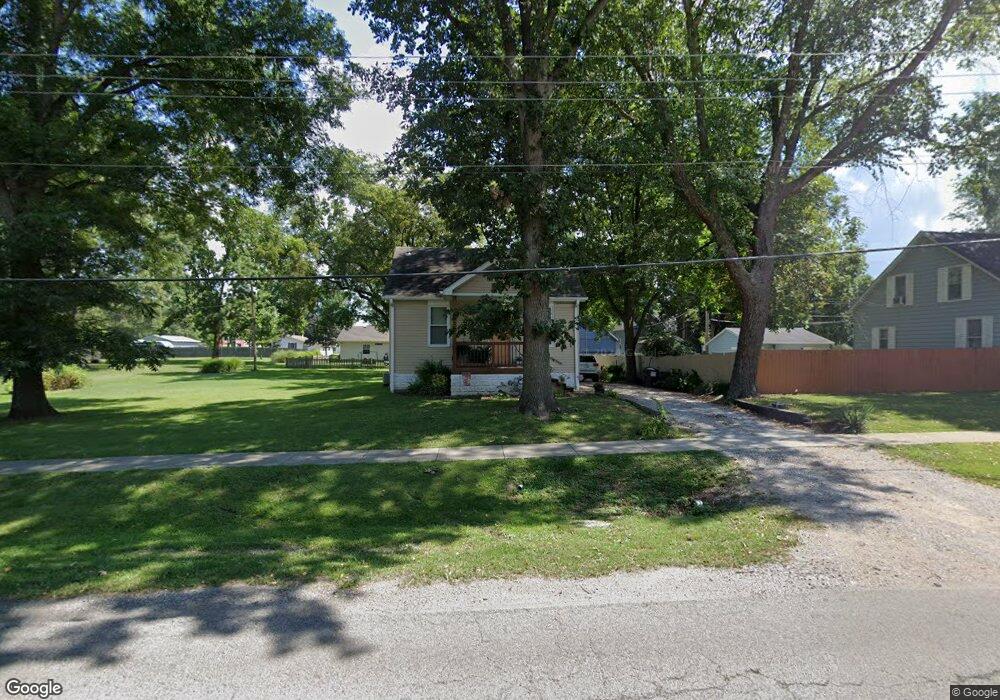
502 N Main St Freeburg, IL 62243
Estimated Value: $111,409 - $144,000
--
Bed
--
Bath
576
Sq Ft
$224/Sq Ft
Est. Value
About This Home
This home is located at 502 N Main St, Freeburg, IL 62243 and is currently estimated at $128,852, approximately $223 per square foot. 502 N Main St is a home located in St. Clair County with nearby schools including Freeburg Elementary School, Freeburg Community High School, and St. Joseph Catholic School.
Ownership History
Date
Name
Owned For
Owner Type
Purchase Details
Closed on
Jul 2, 2014
Sold by
Groh William R and Groh Beverly A
Bought by
Coca Christina L
Current Estimated Value
Home Financials for this Owner
Home Financials are based on the most recent Mortgage that was taken out on this home.
Original Mortgage
$90,510
Interest Rate
4.5%
Mortgage Type
New Conventional
Purchase Details
Closed on
Jul 13, 2013
Sold by
Furtak Leon
Bought by
Groh William R and Groh Beverly A
Purchase Details
Closed on
Jan 5, 2012
Sold by
Kinzinger Mary E
Bought by
Furtak Leon J
Home Financials for this Owner
Home Financials are based on the most recent Mortgage that was taken out on this home.
Original Mortgage
$67,000
Interest Rate
3.98%
Mortgage Type
Future Advance Clause Open End Mortgage
Create a Home Valuation Report for This Property
The Home Valuation Report is an in-depth analysis detailing your home's value as well as a comparison with similar homes in the area
Home Values in the Area
Average Home Value in this Area
Purchase History
| Date | Buyer | Sale Price | Title Company |
|---|---|---|---|
| Coca Christina L | $92,500 | Nations Title Agency | |
| Groh William R | $85,000 | Fatic | |
| Furtak Leon J | $21,000 | Real Title & Escrow Svc Inc |
Source: Public Records
Mortgage History
| Date | Status | Borrower | Loan Amount |
|---|---|---|---|
| Previous Owner | Coca Christina L | $90,510 | |
| Previous Owner | Furtak Leon J | $67,000 |
Source: Public Records
Tax History Compared to Growth
Tax History
| Year | Tax Paid | Tax Assessment Tax Assessment Total Assessment is a certain percentage of the fair market value that is determined by local assessors to be the total taxable value of land and additions on the property. | Land | Improvement |
|---|---|---|---|---|
| 2024 | $2,742 | $38,793 | $8,380 | $30,413 |
| 2023 | $2,655 | $37,313 | $8,088 | $29,225 |
| 2022 | $2,510 | $34,964 | $7,579 | $27,385 |
| 2021 | $2,400 | $32,916 | $7,135 | $25,781 |
| 2020 | $2,266 | $29,945 | $6,491 | $23,454 |
| 2019 | $2,081 | $29,181 | $6,709 | $22,472 |
| 2018 | $2,040 | $28,795 | $6,620 | $22,175 |
| 2017 | $1,932 | $27,531 | $6,329 | $21,202 |
| 2016 | $1,904 | $26,386 | $6,066 | $20,320 |
| 2014 | $2,053 | $25,068 | $6,225 | $18,843 |
| 2013 | $1,612 | $24,844 | $6,169 | $18,675 |
Source: Public Records
Map
Nearby Homes
- 302 N Railroad St
- 206 N Main St
- 312 W Phillips St
- 401 N Edison St
- 520 N Edison St
- 207 N Edison St
- 106 S Vine St
- 440 Foxtail Dr
- 420 Foxtail Dr
- 433 Foxtail Dr
- 3 Park St
- 363 Sleeping Indian Dr
- 359 Sleeping Indian Dr
- 304 Torrington Ln
- 222 Alamosa Dr
- 227 Alamosa Dr
- 103 Draco Dr
- 0 Hickory Dr
- 109 Willow Dr
- 111 Willow Dr