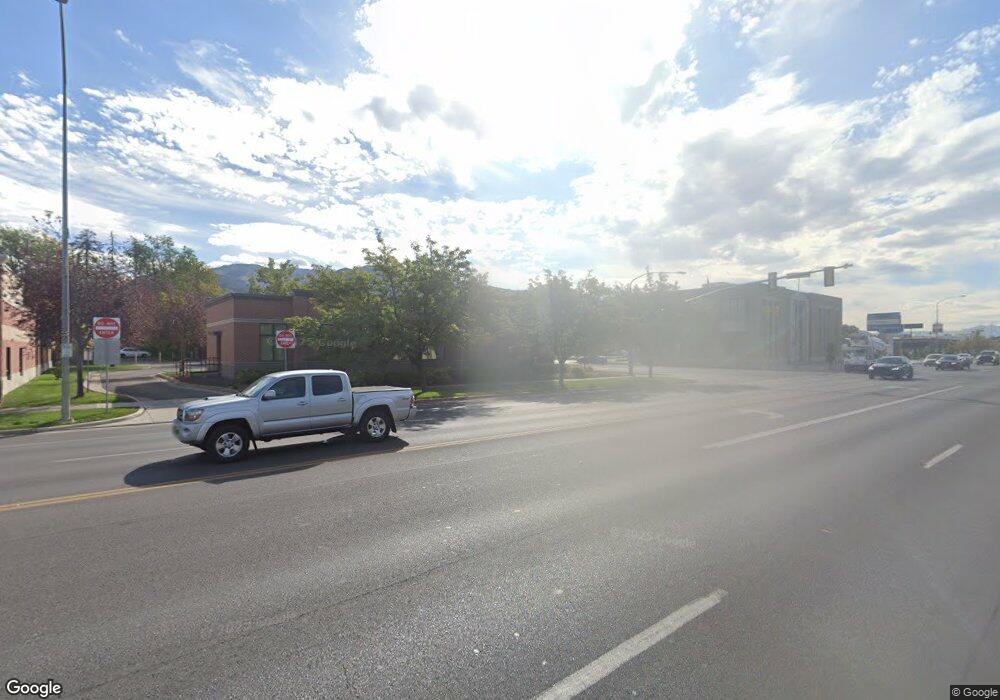
502 N Main St Logan, UT 84321
Adams NeighborhoodEstimated Value: $1,184,000
Studio
--
Bath
5,545
Sq Ft
$214/Sq Ft
Est. Value
About This Home
This home is located at 502 N Main St, Logan, UT 84321 and is currently priced at $1,184,000, approximately $213 per square foot. 502 N Main St is a home located in Cache County with nearby schools including Adams Elementary School, Mount Logan Middle School, and Logan High School.
Ownership History
Date
Name
Owned For
Owner Type
Purchase Details
Closed on
Jan 20, 2017
Sold by
Mijares Jan
Bought by
Mijares Jan and The Jan M Mijares Trust
Current Estimated Value
Home Financials for this Owner
Home Financials are based on the most recent Mortgage that was taken out on this home.
Original Mortgage
$890,517
Outstanding Balance
$735,844
Interest Rate
4.3%
Mortgage Type
Credit Line Revolving
Purchase Details
Closed on
Aug 30, 2011
Sold by
Mijares Jan
Bought by
Mijares Jan
Purchase Details
Closed on
May 2, 2006
Sold by
Karren Steven R and Karren Lee J
Bought by
Mijares Jan
Home Financials for this Owner
Home Financials are based on the most recent Mortgage that was taken out on this home.
Original Mortgage
$340,000
Interest Rate
6.29%
Mortgage Type
Commercial
Create a Home Valuation Report for This Property
The Home Valuation Report is an in-depth analysis detailing your home's value as well as a comparison with similar homes in the area
Home Values in the Area
Average Home Value in this Area
Purchase History
| Date | Buyer | Sale Price | Title Company |
|---|---|---|---|
| Mijares Jan | -- | Hickman Land Title | |
| Mijares Jan | -- | Hickman Land Title | |
| Mijares Jan | -- | None Available | |
| Mijares Jan | -- | Northern Title Company |
Source: Public Records
Mortgage History
| Date | Status | Borrower | Loan Amount |
|---|---|---|---|
| Open | Mijares Jan | $890,517 | |
| Closed | Mijares Jan | $890,517 | |
| Previous Owner | Mijares Jan | $340,000 |
Source: Public Records
Tax History
| Year | Tax Paid | Tax Assessment Tax Assessment Total Assessment is a certain percentage of the fair market value that is determined by local assessors to be the total taxable value of land and additions on the property. | Land | Improvement |
|---|---|---|---|---|
| 2025 | $11,991 | $1,550,794 | $541,721 | $1,009,073 |
| 2024 | $12,383 | $1,551,221 | $541,721 | $1,009,500 |
| 2023 | $12,775 | $1,525,425 | $515,925 | $1,009,500 |
| 2022 | $13,461 | $1,500,857 | $491,357 | $1,009,500 |
| 2021 | $12,861 | $1,218,490 | $388,990 | $829,500 |
| 2020 | $14,290 | $1,218,490 | $388,990 | $829,500 |
| 2019 | $14,936 | $1,218,490 | $388,990 | $829,500 |
| 2018 | $16,359 | $1,218,490 | $388,990 | $829,500 |
| 2017 | $17,017 | $1,218,490 | $0 | $0 |
| 2016 | $17,644 | $1,198,990 | $0 | $0 |
| 2015 | $17,381 | $1,198,990 | $0 | $0 |
| 2014 | $15,712 | $1,198,990 | $0 | $0 |
| 2013 | -- | $1,143,870 | $0 | $0 |
Source: Public Records
Map
Nearby Homes
Your Personal Tour Guide
Ask me questions while you tour the home.