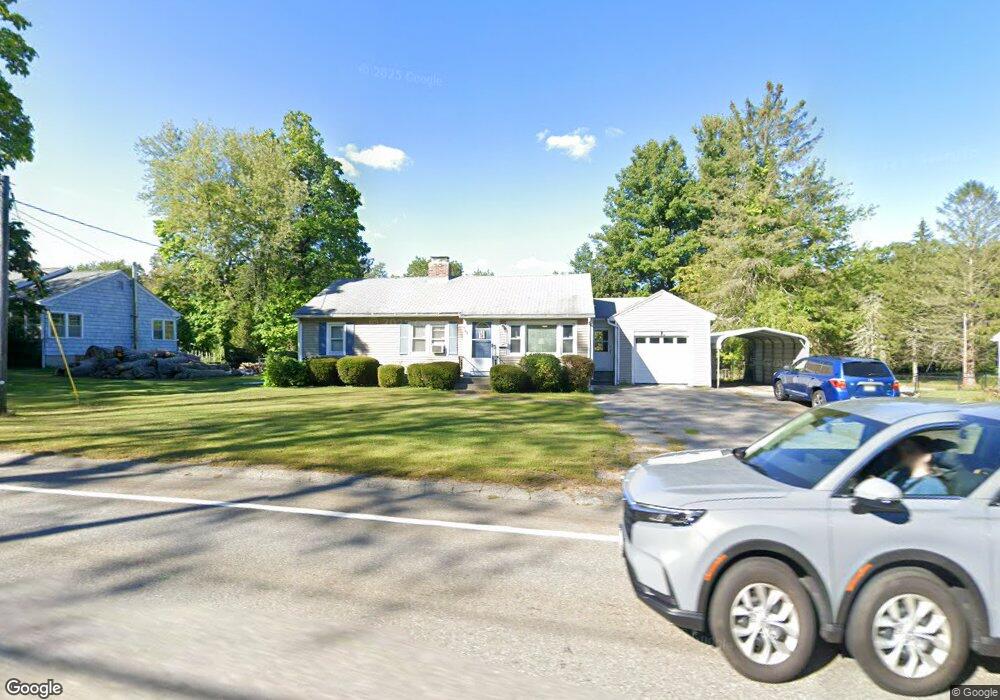
502 Pleasant St Paxton, MA 01612
Estimated Value: $358,831 - $416,000
2
Beds
1
Bath
1,016
Sq Ft
$387/Sq Ft
Est. Value
About This Home
This home is located at 502 Pleasant St, Paxton, MA 01612 and is currently estimated at $392,958, approximately $386 per square foot. 502 Pleasant St is a home located in Worcester County with nearby schools including Wachusett Regional High School, Holden Christian Academy, and Worcester Seventh-Day Adventist School.
Ownership History
Date
Name
Owned For
Owner Type
Purchase Details
Closed on
Mar 30, 1990
Sold by
Lieber Steven
Bought by
Berthel James F
Current Estimated Value
Home Financials for this Owner
Home Financials are based on the most recent Mortgage that was taken out on this home.
Original Mortgage
$104,400
Interest Rate
9.96%
Mortgage Type
Purchase Money Mortgage
Create a Home Valuation Report for This Property
The Home Valuation Report is an in-depth analysis detailing your home's value as well as a comparison with similar homes in the area
Home Values in the Area
Average Home Value in this Area
Purchase History
| Date | Buyer | Sale Price | Title Company |
|---|---|---|---|
| Berthel James F | $116,000 | -- |
Source: Public Records
Mortgage History
| Date | Status | Borrower | Loan Amount |
|---|---|---|---|
| Open | Berthel James F | $131,661 | |
| Closed | Berthel James F | $91,000 | |
| Closed | Berthel James F | $104,400 | |
| Previous Owner | Berthel James F | $10,000 |
Source: Public Records
Tax History Compared to Growth
Tax History
| Year | Tax Paid | Tax Assessment Tax Assessment Total Assessment is a certain percentage of the fair market value that is determined by local assessors to be the total taxable value of land and additions on the property. | Land | Improvement |
|---|---|---|---|---|
| 2025 | $4,522 | $306,800 | $97,600 | $209,200 |
| 2024 | $4,884 | $303,900 | $97,600 | $206,300 |
| 2023 | $4,907 | $279,100 | $88,700 | $190,400 |
| 2022 | $4,667 | $245,900 | $88,700 | $157,200 |
| 2021 | $3,201 | $216,600 | $80,800 | $135,800 |
| 2020 | $9,513 | $208,100 | $72,300 | $135,800 |
| 2019 | $3,976 | $201,400 | $65,600 | $135,800 |
| 2018 | $3,790 | $185,500 | $62,600 | $122,900 |
| 2017 | $3,519 | $172,600 | $59,600 | $113,000 |
| 2016 | $3,301 | $160,300 | $59,600 | $100,700 |
| 2015 | $3,073 | $147,800 | $59,600 | $88,200 |
| 2014 | $2,986 | $145,600 | $59,600 | $86,000 |
Source: Public Records
Map
Nearby Homes