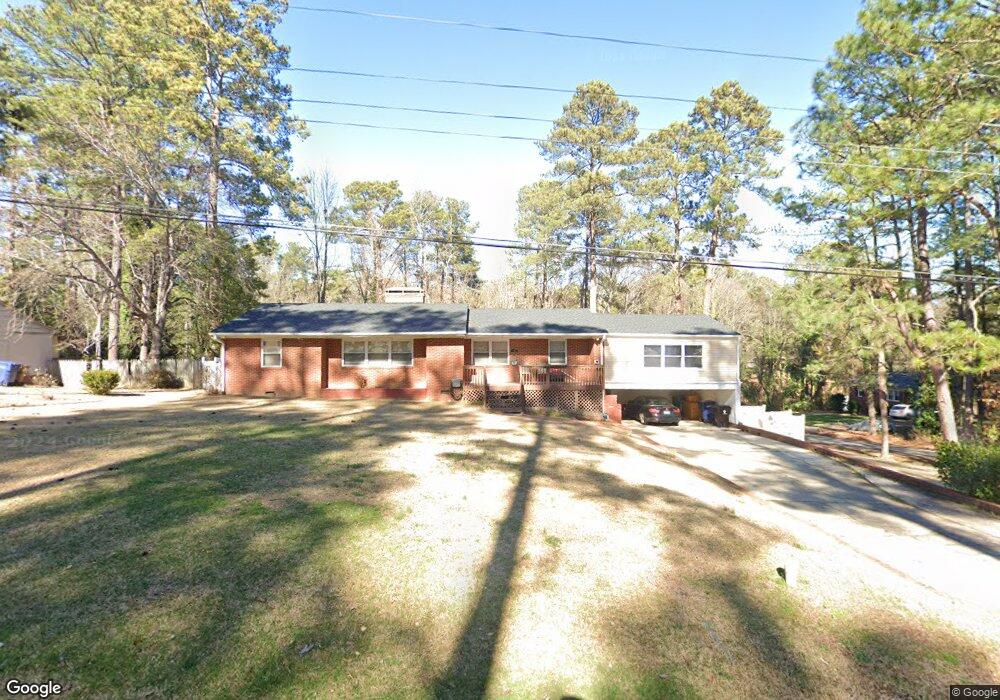
502 Queens Rd Sanford, NC 27330
Estimated Value: $241,000 - $298,000
3
Beds
3
Baths
1,416
Sq Ft
$197/Sq Ft
Est. Value
About This Home
This home is located at 502 Queens Rd, Sanford, NC 27330 and is currently estimated at $278,797, approximately $196 per square foot. 502 Queens Rd is a home located in Lee County with nearby schools including Benjamin T. Bullock Elementary School, West Lee Middle School, and Lee County High School.
Ownership History
Date
Name
Owned For
Owner Type
Purchase Details
Closed on
Dec 14, 2017
Sold by
Vo Quy
Bought by
Vo Nhuquy
Current Estimated Value
Home Financials for this Owner
Home Financials are based on the most recent Mortgage that was taken out on this home.
Original Mortgage
$82,400
Outstanding Balance
$45,873
Interest Rate
3.94%
Mortgage Type
New Conventional
Estimated Equity
$232,924
Purchase Details
Closed on
Mar 8, 2017
Sold by
Deutsche Bank National Trust Co
Bought by
Vo Quy
Purchase Details
Closed on
Aug 25, 2016
Sold by
Godsey Charles Larry and Godsey Patricia Ann
Bought by
Deutsche Bank National Trust Co
Purchase Details
Closed on
Feb 10, 2006
Sold by
Phelps Gary P and Phelps Larura B
Bought by
Godsey Charles Larry and Godsey Patricia Ann
Home Financials for this Owner
Home Financials are based on the most recent Mortgage that was taken out on this home.
Original Mortgage
$99,200
Interest Rate
6.14%
Mortgage Type
Purchase Money Mortgage
Create a Home Valuation Report for This Property
The Home Valuation Report is an in-depth analysis detailing your home's value as well as a comparison with similar homes in the area
Home Values in the Area
Average Home Value in this Area
Purchase History
| Date | Buyer | Sale Price | Title Company |
|---|---|---|---|
| Vo Nhuquy | $103,000 | None Available | |
| Vo Quy | $56,000 | None Available | |
| Deutsche Bank National Trust Co | $101,000 | None Available | |
| Godsey Charles Larry | $124,000 | None Available |
Source: Public Records
Mortgage History
| Date | Status | Borrower | Loan Amount |
|---|---|---|---|
| Open | Vo Nhuquy | $82,400 | |
| Previous Owner | Godsey Charles Larry | $99,200 |
Source: Public Records
Tax History
| Year | Tax Paid | Tax Assessment Tax Assessment Total Assessment is a certain percentage of the fair market value that is determined by local assessors to be the total taxable value of land and additions on the property. | Land | Improvement |
|---|---|---|---|---|
| 2025 | $2,740 | $200,000 | $30,000 | $170,000 |
| 2024 | $2,720 | $200,000 | $30,000 | $170,000 |
| 2023 | $2,710 | $200,000 | $30,000 | $170,000 |
| 2022 | $1,981 | $123,000 | $20,000 | $103,000 |
| 2021 | $1,836 | $110,600 | $20,000 | $90,600 |
| 2020 | $1,831 | $110,600 | $20,000 | $90,600 |
| 2019 | $1,791 | $110,600 | $20,000 | $90,600 |
| 2018 | $1,776 | $109,600 | $15,000 | $94,600 |
| 2017 | $1,744 | $108,900 | $15,000 | $93,900 |
| 2016 | $1,719 | $108,900 | $15,000 | $93,900 |
| 2014 | $1,637 | $108,900 | $15,000 | $93,900 |
Source: Public Records
Map
Nearby Homes
- 620 N Horner Blvd
- 511 Maplewood Dr
- 515 Walnut Dr
- 609 N Steele St
- 500 N Gulf St
- 0 N Gulf St Unit 10076514
- 0 N Carolina 87 Unit 753108
- 321 N Gulf St
- 0 Greensboro Ave
- 516 Cross St
- 321 N Steele St
- 505 Cross St
- 521 Lionheart Ln
- 709 Hawkins Ave
- 500 Greensboro Ave
- 455 Crusaders Dr
- 500 Lionheart Ln
- 221 Stroud St
- 525 Tucks Ct
- 545 Tucks Ct
Your Personal Tour Guide
Ask me questions while you tour the home.