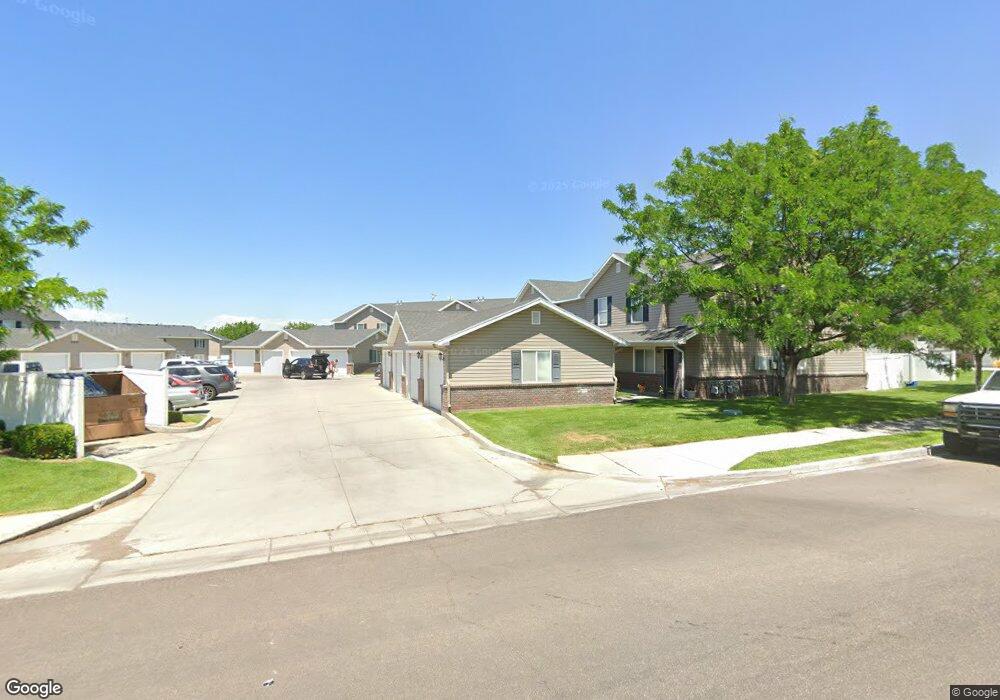
502 Raven Way Unit C Pocatello, ID 83202
Estimated Value: $210,000 - $229,000
2
Beds
2
Baths
1,250
Sq Ft
$174/Sq Ft
Est. Value
About This Home
This home is located at 502 Raven Way Unit C, Pocatello, ID 83202 and is currently estimated at $217,705, approximately $174 per square foot. 502 Raven Way Unit C is a home located in Bannock County with nearby schools including Syringa Elementary School, Kinport Academy, and Highland High School.
Ownership History
Date
Name
Owned For
Owner Type
Purchase Details
Closed on
Mar 27, 2023
Sold by
Lowry Shawn T and Lowry Sarah E
Bought by
Lowry Shawn T
Current Estimated Value
Home Financials for this Owner
Home Financials are based on the most recent Mortgage that was taken out on this home.
Original Mortgage
$30,000
Outstanding Balance
$29,022
Interest Rate
6.12%
Mortgage Type
Credit Line Revolving
Estimated Equity
$188,683
Purchase Details
Closed on
Jul 30, 2009
Sold by
Hernandez Marcos and Hernandez Amy
Bought by
Lowry Shawn T
Home Financials for this Owner
Home Financials are based on the most recent Mortgage that was taken out on this home.
Original Mortgage
$84,442
Interest Rate
5.3%
Mortgage Type
FHA
Purchase Details
Closed on
Nov 4, 2005
Sold by
Pheasant Ridge Development Inc
Bought by
Hernandez Marcos and Hernandez Amy
Home Financials for this Owner
Home Financials are based on the most recent Mortgage that was taken out on this home.
Original Mortgage
$79,707
Interest Rate
5.93%
Mortgage Type
FHA
Create a Home Valuation Report for This Property
The Home Valuation Report is an in-depth analysis detailing your home's value as well as a comparison with similar homes in the area
Home Values in the Area
Average Home Value in this Area
Purchase History
| Date | Buyer | Sale Price | Title Company |
|---|---|---|---|
| Lowry Shawn T | -- | Accommodation/Courtesy Recordi | |
| Lowry Shawn T | -- | -- | |
| Hernandez Marcos | -- | -- |
Source: Public Records
Mortgage History
| Date | Status | Borrower | Loan Amount |
|---|---|---|---|
| Open | Lowry Shawn T | $30,000 | |
| Previous Owner | Lowry Shawn T | $84,442 | |
| Previous Owner | Lowry Shawn T | $3,010 | |
| Previous Owner | Hernandez Marcos | $79,707 |
Source: Public Records
Tax History Compared to Growth
Tax History
| Year | Tax Paid | Tax Assessment Tax Assessment Total Assessment is a certain percentage of the fair market value that is determined by local assessors to be the total taxable value of land and additions on the property. | Land | Improvement |
|---|---|---|---|---|
| 2025 | $1,170 | $226,740 | $42,000 | $184,740 |
| 2024 | $1,135 | $195,600 | $42,000 | $153,600 |
| 2023 | $1,242 | $192,640 | $26,000 | $166,640 |
| 2022 | $1,242 | $124,830 | $18,225 | $106,605 |
| 2021 | $1,081 | $124,830 | $18,225 | $106,605 |
| 2020 | $984 | $124,830 | $18,225 | $106,605 |
| 2019 | $1,059 | $106,919 | $18,225 | $88,694 |
| 2018 | $991 | $88,000 | $15,000 | $73,000 |
| 2017 | $865 | $78,115 | $12,500 | $65,615 |
| 2016 | $864 | $78,115 | $12,500 | $65,615 |
| 2015 | $880 | $0 | $0 | $0 |
| 2012 | -- | $74,155 | $12,500 | $61,655 |
Source: Public Records
Map
Nearby Homes
- 493 Raven Way
- 461 Raven Way
- 439 Pheasant Ridge Dr
- 439 Pheasant Ridge Dr Unit C
- 530d Pheasant Ridge Dr
- 26 Eagle Dr
- 431 Briarwood St
- 4456 Mountain Park Rd
- 726 Brundage St
- 4487 Teewinot St
- 827 Mountain Park Rd
- 1285 Dolostone Dr
- Lot 24 Blk 3 Dolostone Dr
- Lot 12 Blk 2 Dolostone Dr
- 4599 Pocahontas Dr
- 4734 Declaration Dr
- 00 E Quinn Rd
- TBD(11) Hiline Rd
- 4732 Revere Rd
- 4946 Mary Ln
- 502 Raven Way Unit A
- 502 Raven Way Unit B
- 502 Raven Way Unit D
- 502 Raven Way
- 494 A Raven Way
- 494 Raven Way Unit A
- 494 Raven Way Unit B
- 494 Raven Way Unit C
- 494 Raven Way Unit D
- 516 Raven Way Unit A
- 516 Raven Way Unit B
- 516 Raven Way Unit C
- 516 Raven Way Unit D
- 516 Raven Way
- 526 Raven Way Unit A
- 526 Raven Way Unit B
- 526 Raven Way Unit C
- 526 Raven Way Unit D
- 526 Raven Way
- 484 Raven Way Unit A