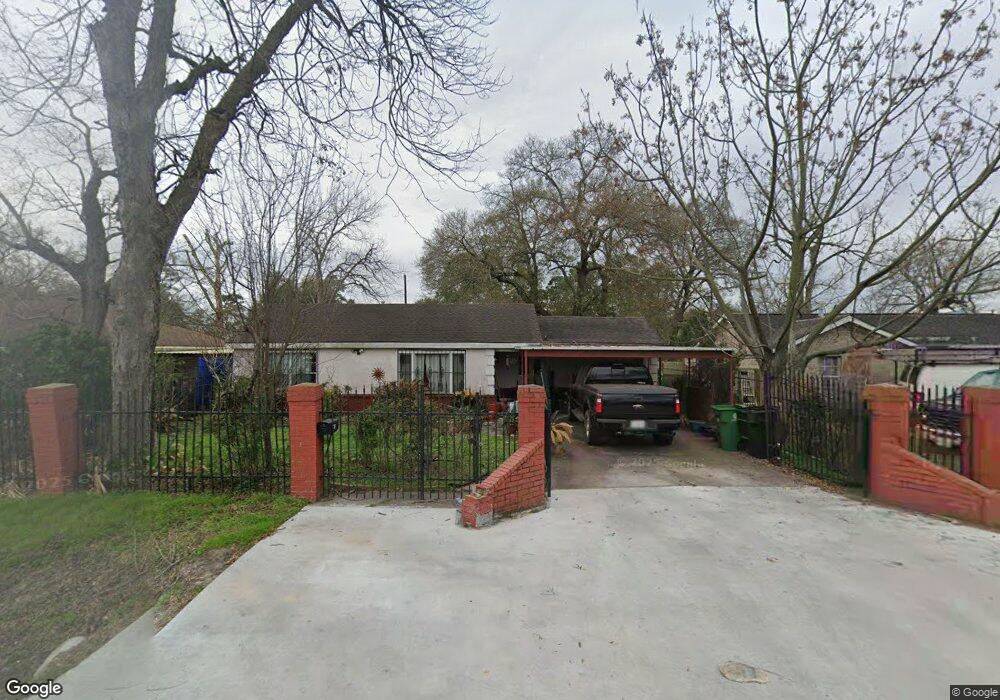
502 Robmore St Houston, TX 77076
Northside-Northline NeighborhoodEstimated Value: $186,717 - $255,000
2
Beds
2
Baths
1,285
Sq Ft
$168/Sq Ft
Est. Value
About This Home
This home is located at 502 Robmore St, Houston, TX 77076 and is currently estimated at $215,929, approximately $168 per square foot. 502 Robmore St is a home located in Harris County with nearby schools including Lyons Elementary School, Fonville Middle School, and Sam Houston Math, Science & Technology Center.
Ownership History
Date
Name
Owned For
Owner Type
Purchase Details
Closed on
Jun 11, 2007
Sold by
Vela Romulo and Vela Irma M
Bought by
Chavez Livida E and Martinez Migual
Current Estimated Value
Home Financials for this Owner
Home Financials are based on the most recent Mortgage that was taken out on this home.
Original Mortgage
$95,000
Outstanding Balance
$58,035
Interest Rate
6.16%
Mortgage Type
Purchase Money Mortgage
Estimated Equity
$157,894
Create a Home Valuation Report for This Property
The Home Valuation Report is an in-depth analysis detailing your home's value as well as a comparison with similar homes in the area
Home Values in the Area
Average Home Value in this Area
Purchase History
| Date | Buyer | Sale Price | Title Company |
|---|---|---|---|
| Chavez Livida E | -- | Houston Title Co |
Source: Public Records
Mortgage History
| Date | Status | Borrower | Loan Amount |
|---|---|---|---|
| Open | Chavez Livida E | $95,000 |
Source: Public Records
Tax History Compared to Growth
Tax History
| Year | Tax Paid | Tax Assessment Tax Assessment Total Assessment is a certain percentage of the fair market value that is determined by local assessors to be the total taxable value of land and additions on the property. | Land | Improvement |
|---|---|---|---|---|
| 2025 | $1,438 | $178,694 | $88,065 | $90,629 |
| 2024 | $1,438 | $183,092 | $88,065 | $95,027 |
| 2023 | $1,438 | $183,092 | $88,065 | $95,027 |
| 2022 | $2,503 | $136,274 | $46,479 | $89,795 |
| 2021 | $2,409 | $114,225 | $46,479 | $67,746 |
| 2020 | $2,275 | $102,341 | $46,479 | $55,862 |
| 2019 | $2,161 | $102,341 | $46,479 | $55,862 |
| 2018 | $1,962 | $77,647 | $41,586 | $36,061 |
| 2017 | $1,896 | $77,647 | $41,586 | $36,061 |
| 2016 | $1,724 | $77,647 | $41,586 | $36,061 |
| 2015 | $1,102 | $61,970 | $29,355 | $32,615 |
| 2014 | $1,102 | $61,970 | $29,355 | $32,615 |
Source: Public Records
Map
Nearby Homes
- 283 Turner Dr
- 415 Briarcliff Dr
- 207 Dipping Stream St
- 1105 Soren Ln
- 9907 Dipping Brook St
- 9920 Dipping Woods St
- 9905 Dipping Brook St
- 9916 Dipping Woods St
- 9925 Dipping Woods St
- 9913 Dipping Woods St
- 606 Cresline St
- 9909 Dipping Woods St
- 219 Heaney Dr
- 9902 Clark Rd Unit D
- 9902 Clark Rd Unit I
- 9902 Clark Rd Unit G
- 401 Cresline St
- 153 Treasure Dr
- 513 Mayford St
- 129 E Sunnyside St