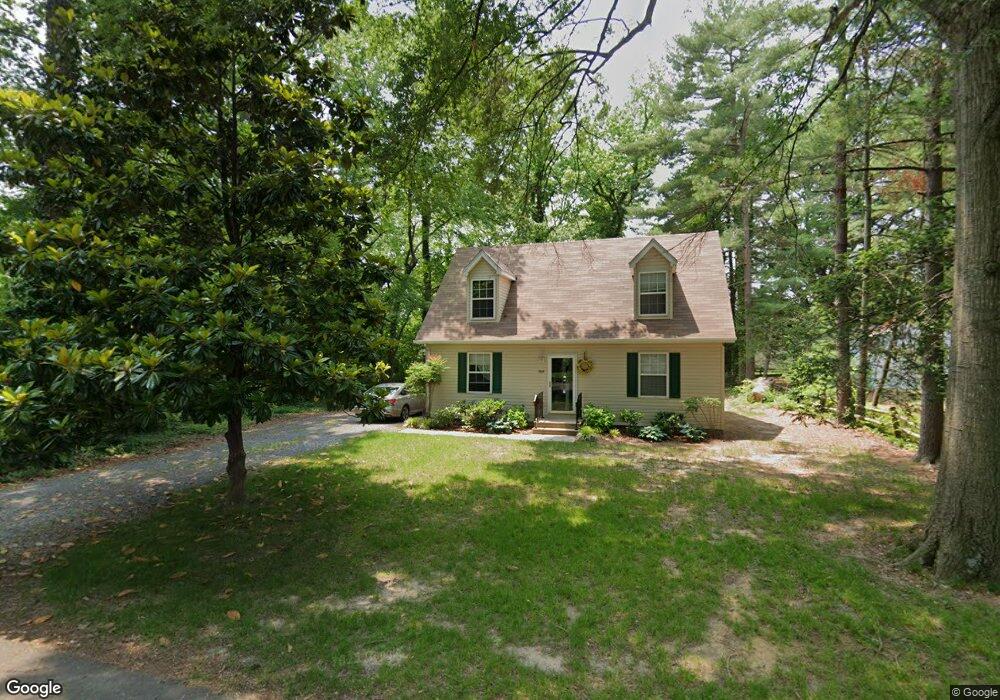
502 S 4th St Denton, MD 21629
Estimated Value: $256,000 - $295,000
Studio
2
Baths
1,326
Sq Ft
$205/Sq Ft
Est. Value
About This Home
This home is located at 502 S 4th St, Denton, MD 21629 and is currently estimated at $272,443, approximately $205 per square foot. 502 S 4th St is a home located in Caroline County with nearby schools including Denton Elementary School, Lockerman Middle School, and North Caroline High School.
Ownership History
Date
Name
Owned For
Owner Type
Purchase Details
Closed on
Dec 3, 2002
Sold by
Ness Carlton J and Ness Lisa D
Bought by
Manning Cynthia L
Current Estimated Value
Purchase Details
Closed on
Sep 14, 2001
Sold by
Nagel Frederick A
Bought by
Ness Carlton J and Ness Lisa D
Purchase Details
Closed on
Aug 18, 1999
Sold by
Hart Mark K and Hart Lesa R
Bought by
Nagel Frederick A
Purchase Details
Closed on
Nov 29, 1996
Sold by
Foster Daniel B
Bought by
Hart Mark K and Hart Lesa R
Purchase Details
Closed on
Sep 18, 1996
Sold by
Huddleston Mary Eleanor Duffey
Bought by
Foster Daniel B
Create a Home Valuation Report for This Property
The Home Valuation Report is an in-depth analysis detailing your home's value as well as a comparison with similar homes in the area
Home Values in the Area
Average Home Value in this Area
Purchase History
| Date | Buyer | Sale Price | Title Company |
|---|---|---|---|
| Manning Cynthia L | $124,900 | -- | |
| Ness Carlton J | $115,000 | -- | |
| Nagel Frederick A | $106,000 | -- | |
| Hart Mark K | $93,000 | -- | |
| Foster Daniel B | $15,000 | -- |
Source: Public Records
Mortgage History
| Date | Status | Borrower | Loan Amount |
|---|---|---|---|
| Closed | Foster Daniel B | -- |
Source: Public Records
Tax History
| Year | Tax Paid | Tax Assessment Tax Assessment Total Assessment is a certain percentage of the fair market value that is determined by local assessors to be the total taxable value of land and additions on the property. | Land | Improvement |
|---|---|---|---|---|
| 2025 | $3,350 | $198,000 | $58,000 | $140,000 |
| 2024 | $3,104 | $180,233 | $0 | $0 |
| 2023 | $2,846 | $162,467 | $0 | $0 |
| 2022 | $2,564 | $144,700 | $52,000 | $92,700 |
| 2021 | $2,510 | $142,000 | $0 | $0 |
| 2020 | $2,510 | $139,300 | $0 | $0 |
| 2019 | $2,462 | $136,600 | $39,200 | $97,400 |
| 2018 | $2,448 | $136,600 | $39,200 | $97,400 |
| 2017 | $2,421 | $136,600 | $0 | $0 |
| 2016 | -- | $138,200 | $0 | $0 |
| 2015 | $2,300 | $138,200 | $0 | $0 |
| 2014 | $2,300 | $138,200 | $0 | $0 |
Source: Public Records
Map
Nearby Homes
- 318 Carter Ave
- 311 Kerr Ave
- 341 Academy Ave
- 207 S 7th St
- 112 S 5th Ave
- 106 S 6th St
- 300 S 1st St
- 406 Lincoln St
- 501 Lincoln St
- 1005 Market St
- 1302 Trice Meadows Cir
- 1111 Trice Meadows Cir
- 322 Deep Shore Rd
- 1303 Fairfield Ct
- 1203 Tuckahoe Ct
- 24872 Meeting House Rd
- 1507 Blue Heron Dr
- 1907 Blue Heron Dr
- 1202 Blue Heron Dr
- 1204 Blue Heron Dr
Your Personal Tour Guide
Ask me questions while you tour the home.