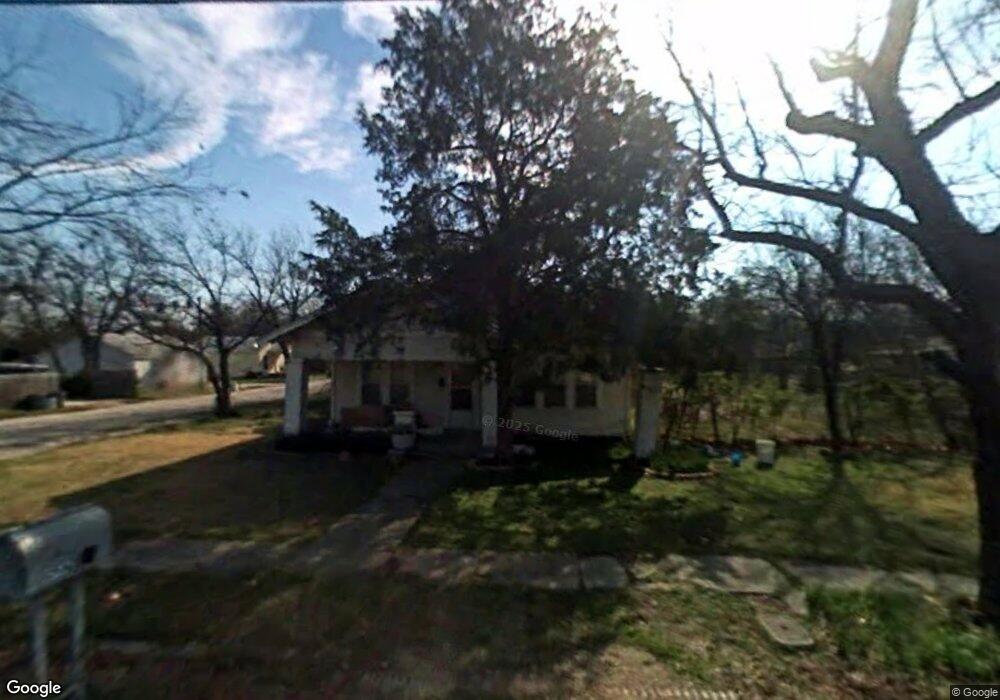
502 S 7th St Sanger, TX 76266
Estimated Value: $257,000 - $323,000
Studio
--
Bath
1,469
Sq Ft
$192/Sq Ft
Est. Value
About This Home
This home is located at 502 S 7th St, Sanger, TX 76266 and is currently estimated at $281,455, approximately $191 per square foot. 502 S 7th St is a home located in Denton County with nearby schools including Chisholm Trail Elementary School, Clear Creek Intermediate School, and Sanger Sixth Grade Campus.
Ownership History
Date
Name
Owned For
Owner Type
Purchase Details
Closed on
Sep 24, 2015
Sold by
Shelton Mary Lucille and Shelton Oscar
Bought by
Buenrrostro Primo Correa
Current Estimated Value
Purchase Details
Closed on
Oct 3, 2003
Sold by
Cole Guinn and Cole Robert William
Bought by
Shelton Mary Lucille and Shelton Oscar
Home Financials for this Owner
Home Financials are based on the most recent Mortgage that was taken out on this home.
Original Mortgage
$47,500
Interest Rate
6.24%
Mortgage Type
Purchase Money Mortgage
Create a Home Valuation Report for This Property
The Home Valuation Report is an in-depth analysis detailing your home's value as well as a comparison with similar homes in the area
Home Values in the Area
Average Home Value in this Area
Purchase History
| Date | Buyer | Sale Price | Title Company |
|---|---|---|---|
| Buenrrostro Primo Correa | -- | Title Resources | |
| Shelton Mary Lucille | -- | -- | |
| Shelton Mary Lucille | -- | -- |
Source: Public Records
Mortgage History
| Date | Status | Borrower | Loan Amount |
|---|---|---|---|
| Previous Owner | Shelton Mary Lucille | $47,500 |
Source: Public Records
Tax History
| Year | Tax Paid | Tax Assessment Tax Assessment Total Assessment is a certain percentage of the fair market value that is determined by local assessors to be the total taxable value of land and additions on the property. | Land | Improvement |
|---|---|---|---|---|
| 2025 | $979 | $173,624 | $90,000 | $220,552 |
| 2024 | $3,190 | $157,840 | $0 | $0 |
| 2023 | $880 | $143,491 | $70,000 | $79,647 |
| 2022 | $2,893 | $130,446 | $71,500 | $114,663 |
| 2021 | $2,492 | $161,514 | $58,500 | $103,014 |
| 2020 | $2,385 | $107,805 | $58,500 | $83,590 |
| 2019 | $2,231 | $98,005 | $58,500 | $84,215 |
| 2018 | $2,039 | $89,095 | $58,500 | $71,281 |
| 2017 | $2,789 | $121,259 | $58,500 | $62,759 |
| 2016 | $1,694 | $73,632 | $32,500 | $41,132 |
| 2015 | -- | $57,745 | $32,500 | $25,245 |
| 2014 | -- | $56,530 | $32,500 | $24,030 |
| 2013 | -- | $42,872 | $32,500 | $10,372 |
Source: Public Records
Map
Nearby Homes
Your Personal Tour Guide
Ask me questions while you tour the home.