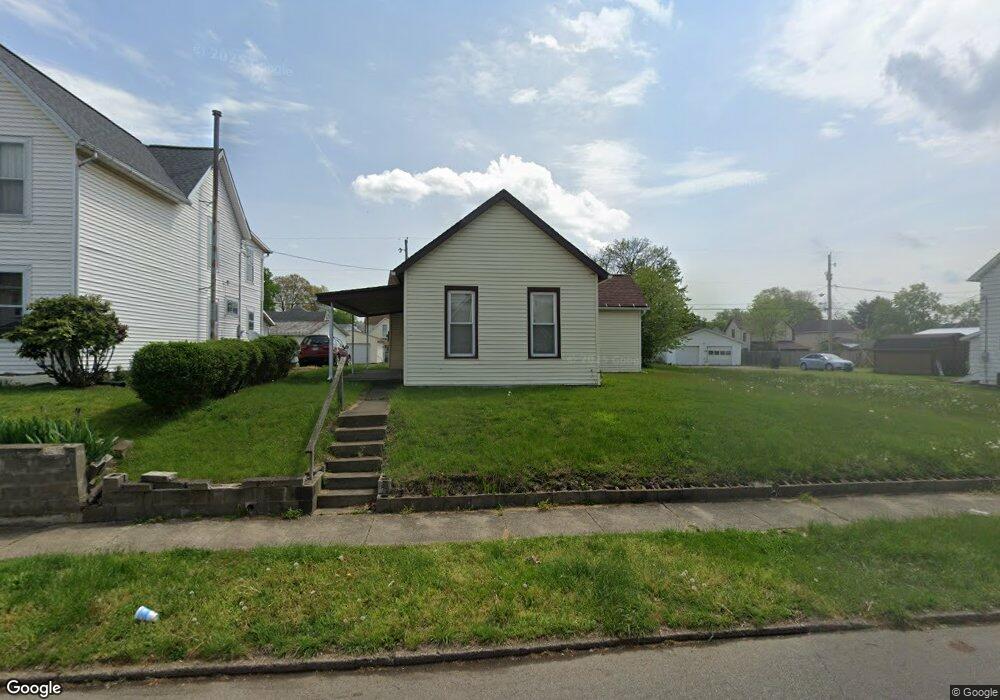
502 S 8th St Coshocton, OH 43812
Estimated Value: $81,000 - $129,000
2
Beds
1
Bath
812
Sq Ft
$122/Sq Ft
Est. Value
About This Home
This home is located at 502 S 8th St, Coshocton, OH 43812 and is currently estimated at $99,149, approximately $122 per square foot. 502 S 8th St is a home located in Coshocton County with nearby schools including Coshocton High School, Coshocton Opportunity School, and Sacred Heart Elementary School.
Ownership History
Date
Name
Owned For
Owner Type
Purchase Details
Closed on
Feb 11, 2010
Sold by
Homesales Inc
Bought by
Davis Gary E and Davs Melissa D
Current Estimated Value
Purchase Details
Closed on
Oct 5, 2009
Sold by
Reichley Harold J
Bought by
Homesales Inc
Purchase Details
Closed on
Jul 26, 2000
Sold by
Reichley Ii Harold J
Bought by
Reichley Ii Harold J
Purchase Details
Closed on
Feb 19, 1998
Sold by
Crouso William Curtis
Bought by
Cosmar Rickard D
Purchase Details
Closed on
Mar 28, 1997
Sold by
Thornsley Valarie S
Bought by
Crouso William Curtis
Purchase Details
Closed on
Jun 14, 1995
Sold by
Noble Harold
Bought by
Noble Harold
Purchase Details
Closed on
Feb 3, 1995
Sold by
Noble Harold
Bought by
Noble Harold
Purchase Details
Closed on
Oct 21, 1993
Sold by
Noble Fred Aka
Bought by
Noble Fred Aka
Purchase Details
Closed on
Sep 15, 1993
Sold by
Noble Fred L
Bought by
Noble Fred L
Create a Home Valuation Report for This Property
The Home Valuation Report is an in-depth analysis detailing your home's value as well as a comparison with similar homes in the area
Home Values in the Area
Average Home Value in this Area
Purchase History
| Date | Buyer | Sale Price | Title Company |
|---|---|---|---|
| Davis Gary E | $11,500 | None Available | |
| Homesales Inc | $13,334 | None Available | |
| Reichley Ii Harold J | $35,000 | -- | |
| Cosmar Rickard D | $30,000 | -- | |
| Crouso William Curtis | $19,000 | -- | |
| Noble Harold | $21,200 | -- | |
| Noble Harold | -- | -- | |
| Noble Fred Aka | -- | -- | |
| Noble Fred L | -- | -- |
Source: Public Records
Tax History Compared to Growth
Tax History
| Year | Tax Paid | Tax Assessment Tax Assessment Total Assessment is a certain percentage of the fair market value that is determined by local assessors to be the total taxable value of land and additions on the property. | Land | Improvement |
|---|---|---|---|---|
| 2024 | $585 | $13,800 | $3,490 | $10,310 |
| 2023 | $585 | $10,833 | $2,681 | $8,152 |
| 2022 | $519 | $10,833 | $2,681 | $8,152 |
| 2021 | $533 | $10,833 | $2,681 | $8,152 |
| 2020 | $432 | $8,474 | $2,727 | $5,747 |
| 2019 | $437 | $8,474 | $2,727 | $5,747 |
| 2018 | $432 | $8,474 | $2,727 | $5,747 |
| 2017 | $440 | $8,292 | $2,545 | $5,747 |
| 2016 | $423 | $8,292 | $2,545 | $5,747 |
| 2015 | $446 | $8,292 | $2,545 | $5,747 |
| 2014 | $488 | $9,227 | $3,462 | $5,765 |
Source: Public Records
Map
Nearby Homes