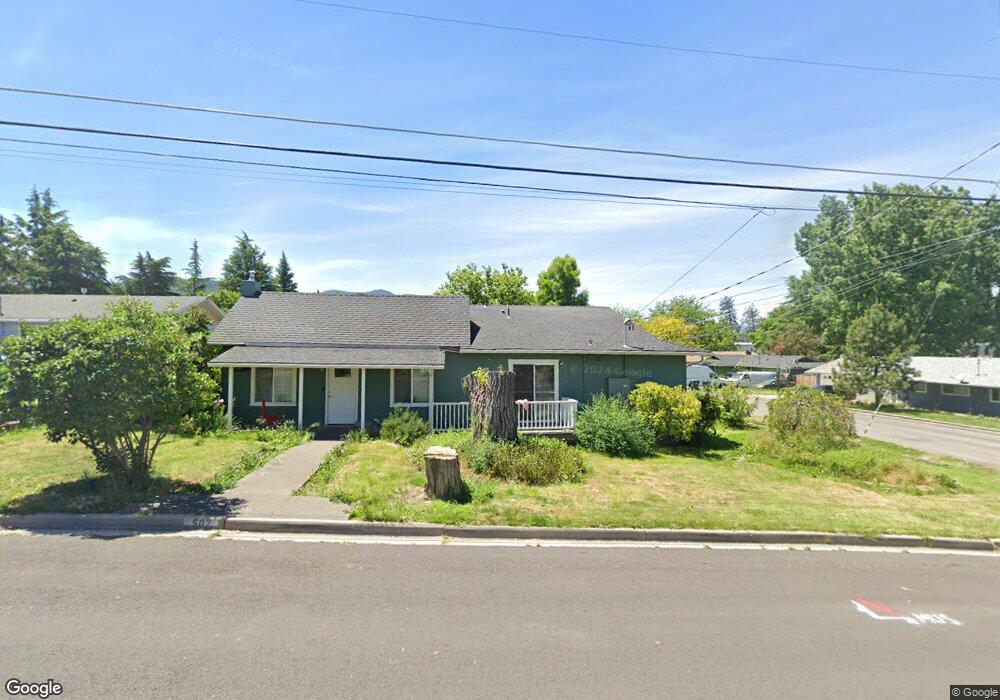
502 S B St Phoenix, OR 97535
Estimated Value: $458,000 - $638,000
7
Beds
4
Baths
3,350
Sq Ft
$163/Sq Ft
Est. Value
About This Home
This home is located at 502 S B St, Phoenix, OR 97535 and is currently estimated at $547,000, approximately $163 per square foot. 502 S B St is a home located in Jackson County with nearby schools including Phoenix Elementary School, Talent Middle School, and Phoenix High School.
Ownership History
Date
Name
Owned For
Owner Type
Purchase Details
Closed on
Jan 8, 2020
Sold by
Iliahi Llc
Bought by
Hodgin Michael Evan
Current Estimated Value
Home Financials for this Owner
Home Financials are based on the most recent Mortgage that was taken out on this home.
Original Mortgage
$276,250
Interest Rate
3.6%
Mortgage Type
Unknown
Purchase Details
Closed on
Aug 4, 2005
Sold by
Iliahi Llc
Bought by
Hecht James Grey
Home Financials for this Owner
Home Financials are based on the most recent Mortgage that was taken out on this home.
Original Mortgage
$196,000
Interest Rate
5.46%
Mortgage Type
Fannie Mae Freddie Mac
Purchase Details
Closed on
Nov 1, 2003
Sold by
Hecht Grey C
Bought by
Iliahi Llc
Purchase Details
Closed on
Mar 14, 2003
Sold by
Shields Connie Rae and Zoll Connie R
Bought by
Hecht Grey C
Home Financials for this Owner
Home Financials are based on the most recent Mortgage that was taken out on this home.
Original Mortgage
$134,000
Interest Rate
5.83%
Create a Home Valuation Report for This Property
The Home Valuation Report is an in-depth analysis detailing your home's value as well as a comparison with similar homes in the area
Home Values in the Area
Average Home Value in this Area
Purchase History
| Date | Buyer | Sale Price | Title Company |
|---|---|---|---|
| Hodgin Michael Evan | $325,000 | First American | |
| Hecht James Grey | -- | Ticor Title | |
| Iliahi Llc | -- | -- | |
| Hecht Grey C | $167,500 | Amerititle |
Source: Public Records
Mortgage History
| Date | Status | Borrower | Loan Amount |
|---|---|---|---|
| Closed | Hodgin Michael Evan | $276,250 | |
| Previous Owner | Hecht James Grey | $196,000 | |
| Previous Owner | Hecht Grey C | $134,000 |
Source: Public Records
Tax History Compared to Growth
Tax History
| Year | Tax Paid | Tax Assessment Tax Assessment Total Assessment is a certain percentage of the fair market value that is determined by local assessors to be the total taxable value of land and additions on the property. | Land | Improvement |
|---|---|---|---|---|
| 2025 | $4,661 | $290,660 | $77,960 | $212,700 |
| 2024 | $4,661 | $282,200 | $75,690 | $206,510 |
| 2023 | $4,515 | $273,990 | $73,480 | $200,510 |
| 2022 | $4,395 | $273,990 | $73,480 | $200,510 |
| 2021 | $4,290 | $266,010 | $71,340 | $194,670 |
| 2020 | $4,155 | $258,270 | $69,260 | $189,010 |
| 2019 | $4,044 | $243,450 | $65,290 | $178,160 |
| 2018 | $3,926 | $236,360 | $63,380 | $172,980 |
| 2017 | $3,709 | $236,360 | $63,380 | $172,980 |
| 2016 | $3,609 | $222,800 | $59,740 | $163,060 |
| 2015 | $3,468 | $222,800 | $52,420 | $170,380 |
| 2014 | $3,337 | $210,020 | $49,410 | $160,610 |
Source: Public Records
Map
Nearby Homes
- 158 Sharon Dr
- 504 Elm St
- 817 Amerman Dr
- 454 Elm St
- 201 S Rose St
- 404 Oak St
- 105 W 1st St
- 309 W 1st St
- 4624 S Pacific Hwy Unit 26
- 4624 S Pacific Hwy Unit 61
- 133 S Main St
- 3459 S Pacific Hwy
- 4119 S Pacific Hwy
- 316 W 3rd St
- 605 W 4th St
- 301 N Church St
- 4601 S Pacific Hwy Unit 3
- 4601 S Pacific Hwy Unit 29
- 4601 S Pacific Hwy Unit 18
- 1620 Pacific Ln