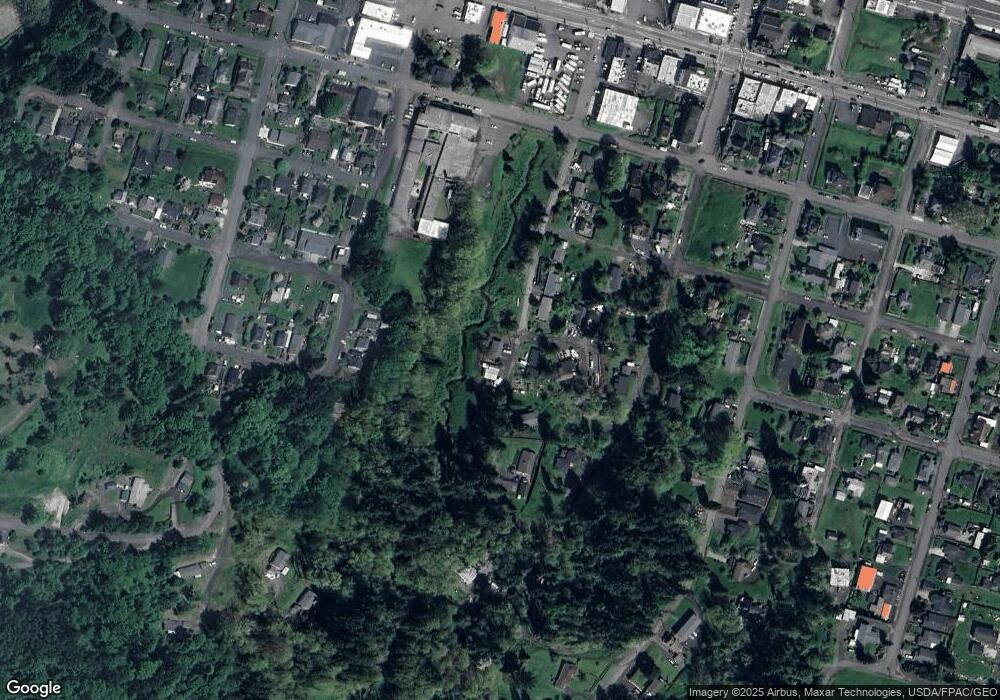
502 W 2nd St Rainier, OR 97048
Estimated Value: $311,661 - $406,000
3
Beds
2
Baths
1,300
Sq Ft
$274/Sq Ft
Est. Value
About This Home
This home is located at 502 W 2nd St, Rainier, OR 97048 and is currently estimated at $356,165, approximately $273 per square foot. 502 W 2nd St is a home located in Columbia County with nearby schools including Hudson Park Elementary School, Rainier Junior/Senior High School, and North Columbia Academy.
Ownership History
Date
Name
Owned For
Owner Type
Purchase Details
Closed on
May 22, 2019
Sold by
Budge Henry
Bought by
Albrecht Diana L
Current Estimated Value
Home Financials for this Owner
Home Financials are based on the most recent Mortgage that was taken out on this home.
Original Mortgage
$157,000
Outstanding Balance
$119,792
Interest Rate
4.1%
Mortgage Type
New Conventional
Estimated Equity
$236,373
Create a Home Valuation Report for This Property
The Home Valuation Report is an in-depth analysis detailing your home's value as well as a comparison with similar homes in the area
Home Values in the Area
Average Home Value in this Area
Purchase History
| Date | Buyer | Sale Price | Title Company |
|---|---|---|---|
| Albrecht Diana L | $196,250 | Ticor |
Source: Public Records
Mortgage History
| Date | Status | Borrower | Loan Amount |
|---|---|---|---|
| Open | Albrecht Diana L | $157,000 |
Source: Public Records
Tax History Compared to Growth
Tax History
| Year | Tax Paid | Tax Assessment Tax Assessment Total Assessment is a certain percentage of the fair market value that is determined by local assessors to be the total taxable value of land and additions on the property. | Land | Improvement |
|---|---|---|---|---|
| 2025 | $2,596 | $140,560 | $32,490 | $108,070 |
| 2024 | $2,536 | $136,470 | $31,550 | $104,920 |
| 2023 | $2,500 | $132,500 | $29,850 | $102,650 |
| 2022 | $2,388 | $128,650 | $28,980 | $99,670 |
| 2021 | $2,349 | $124,910 | $30,860 | $94,050 |
| 2020 | $2,283 | $121,280 | $29,180 | $92,100 |
| 2019 | $2,183 | $117,750 | $28,329 | $89,421 |
| 2018 | $2,181 | $114,330 | $38,080 | $76,250 |
| 2017 | $1,958 | $111,000 | $36,970 | $74,030 |
| 2016 | $1,757 | $99,550 | $33,230 | $66,320 |
| 2015 | $1,521 | $86,690 | $25,080 | $61,610 |
| 2014 | $1,558 | $88,930 | $25,420 | $63,510 |
Source: Public Records
Map
Nearby Homes