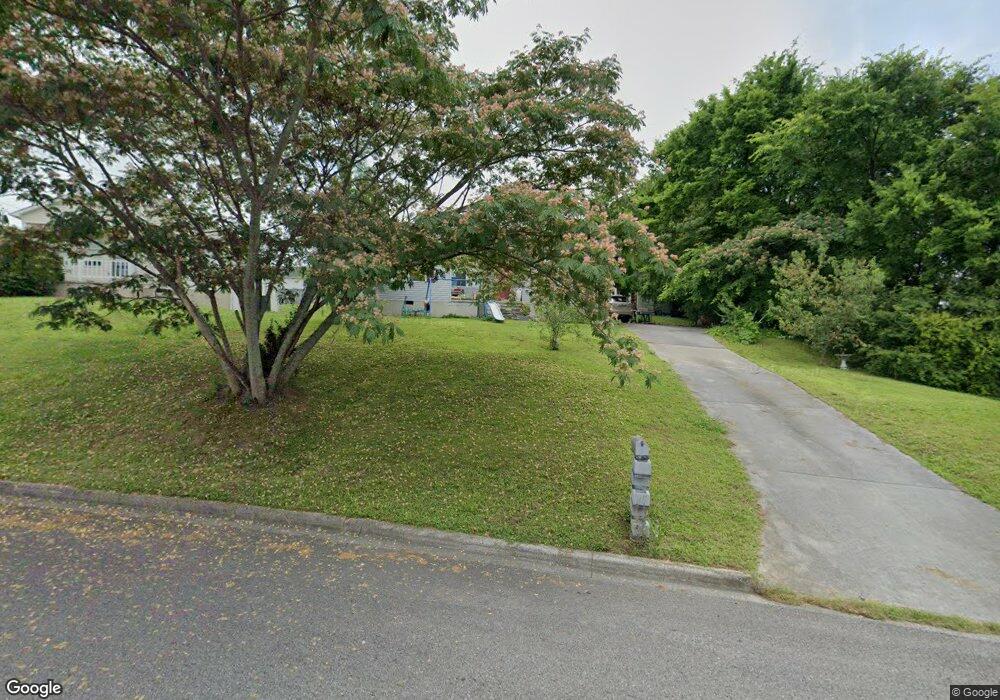
502 W Boundary St Dalton, GA 30720
Estimated Value: $177,704 - $257,000
--
Bed
1
Bath
1,180
Sq Ft
$179/Sq Ft
Est. Value
About This Home
This home is located at 502 W Boundary St, Dalton, GA 30720 and is currently estimated at $210,926, approximately $178 per square foot. 502 W Boundary St is a home located in Whitfield County with nearby schools including Westwood Elementary School, Dalton Middle School, and Dalton High School.
Ownership History
Date
Name
Owned For
Owner Type
Purchase Details
Closed on
Oct 6, 2017
Sold by
Smith Troy L
Bought by
Ballew Joshua Brannigan
Current Estimated Value
Home Financials for this Owner
Home Financials are based on the most recent Mortgage that was taken out on this home.
Original Mortgage
$108,000
Outstanding Balance
$90,113
Interest Rate
3.78%
Mortgage Type
New Conventional
Estimated Equity
$120,813
Purchase Details
Closed on
Jan 1, 1997
Bought by
Smith Troy L
Create a Home Valuation Report for This Property
The Home Valuation Report is an in-depth analysis detailing your home's value as well as a comparison with similar homes in the area
Home Values in the Area
Average Home Value in this Area
Purchase History
| Date | Buyer | Sale Price | Title Company |
|---|---|---|---|
| Ballew Joshua Brannigan | $108,000 | -- | |
| Smith Troy L | -- | -- |
Source: Public Records
Mortgage History
| Date | Status | Borrower | Loan Amount |
|---|---|---|---|
| Open | Ballew Joshua Brannigan | $108,000 |
Source: Public Records
Tax History Compared to Growth
Tax History
| Year | Tax Paid | Tax Assessment Tax Assessment Total Assessment is a certain percentage of the fair market value that is determined by local assessors to be the total taxable value of land and additions on the property. | Land | Improvement |
|---|---|---|---|---|
| 2024 | $1,096 | $59,798 | $8,000 | $51,798 |
| 2023 | $1,096 | $35,660 | $5,400 | $30,260 |
| 2022 | $664 | $26,682 | $5,400 | $21,282 |
| 2021 | $665 | $26,682 | $5,400 | $21,282 |
| 2020 | $680 | $26,682 | $5,400 | $21,282 |
| 2019 | $697 | $26,682 | $5,400 | $21,282 |
| 2018 | $702 | $26,682 | $5,400 | $21,282 |
| 2017 | $963 | $26,682 | $5,400 | $21,282 |
| 2016 | $857 | $23,584 | $4,200 | $19,384 |
| 2014 | $778 | $23,584 | $4,200 | $19,384 |
| 2013 | -- | $23,583 | $4,200 | $19,383 |
Source: Public Records
Map
Nearby Homes