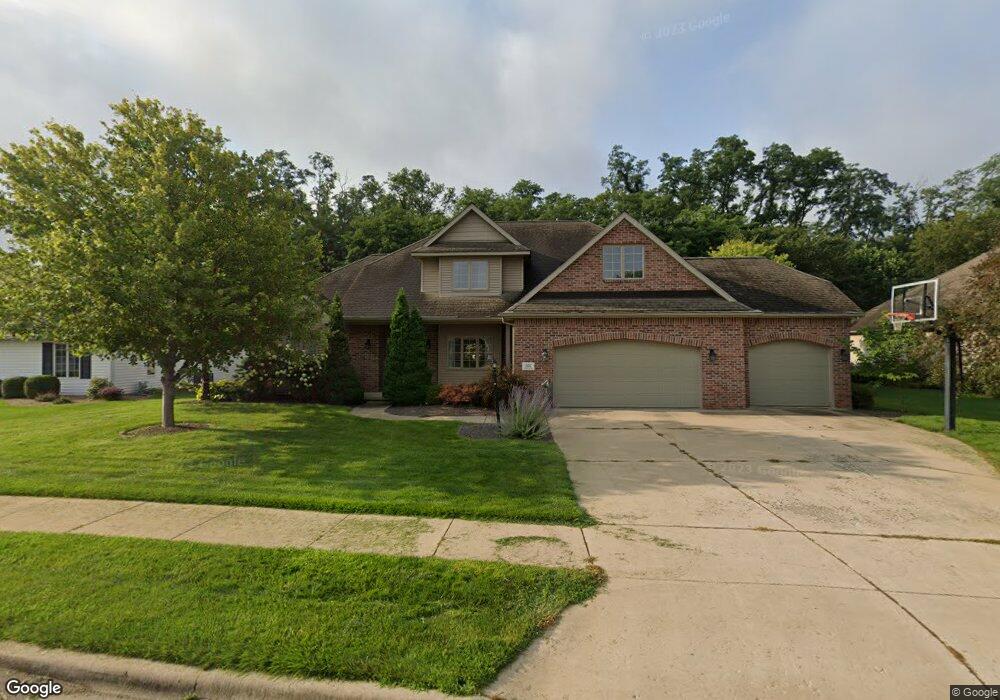
502 W Copperfield Dr Unit D Dunlap, IL 61525
Estimated Value: $496,000 - $513,000
4
Beds
3
Baths
2,992
Sq Ft
$169/Sq Ft
Est. Value
About This Home
This home is located at 502 W Copperfield Dr Unit D, Dunlap, IL 61525 and is currently estimated at $505,210, approximately $168 per square foot. 502 W Copperfield Dr Unit D is a home located in Peoria County with nearby schools including Dunlap Grade School, Dunlap Valley Middle School, and Dunlap High School.
Ownership History
Date
Name
Owned For
Owner Type
Purchase Details
Closed on
Nov 12, 2025
Sold by
Tiller James Randall and Shepherd Patricia Ann
Bought by
Soaring Enterprise Llc
Current Estimated Value
Purchase Details
Closed on
Oct 17, 2022
Sold by
Orcutt Jeffrey W
Bought by
Tiller James Randall and Shepherd Patricia Ann
Home Financials for this Owner
Home Financials are based on the most recent Mortgage that was taken out on this home.
Original Mortgage
$290,000
Interest Rate
5.88%
Mortgage Type
New Conventional
Purchase Details
Closed on
Nov 10, 2016
Sold by
Armstrong Derek J and Armstrong Pamela A
Bought by
Orcutt Jeffrey W and Orcutt Sonia T
Home Financials for this Owner
Home Financials are based on the most recent Mortgage that was taken out on this home.
Original Mortgage
$316,000
Interest Rate
2.75%
Mortgage Type
New Conventional
Create a Home Valuation Report for This Property
The Home Valuation Report is an in-depth analysis detailing your home's value as well as a comparison with similar homes in the area
Purchase History
| Date | Buyer | Sale Price | Title Company |
|---|---|---|---|
| Soaring Enterprise Llc | $500,000 | None Listed On Document | |
| Tiller James Randall | $415,000 | -- | |
| Orcutt Jeffrey W | $395,000 | Attorney Only |
Source: Public Records
Mortgage History
| Date | Status | Borrower | Loan Amount |
|---|---|---|---|
| Previous Owner | Tiller James Randall | $290,000 | |
| Previous Owner | Orcutt Jeffrey W | $316,000 |
Source: Public Records
Map
Nearby Homes
- 919 Copperpoint Dr
- LOT 209 Copperpoint Dr
- LOT 208 Copperpoint Dr
- 628 Copperpoint Dr
- 1017 Copperpoint Dr
- 621 Copper Ridge Ct
- LOT 204 W Salem School Ct
- Lot 136 French Dr
- 408 N 3rd St
- 504 N 4th St
- 11819 N Deerfield Dr
- 13519 N Lakewood Dr
- 13014 N Crater Ln
- 11518 N Nettle Creek Dr
- 11428 N Boulder Creek Ct
- 11124 N Tuscany Ridge Ct
- 11227 N Stone Creek Dr
- 11224 N Sycamore Creek Dr
- 4012 W Hearthwood Dr
- 11117 N Country Ridge Ln
- 510 W Copperfield Dr
- 420 W Copperfield Dr
- 503 W Copperfield Dr
- 516 W Copperfield Dr
- 412 W Copperfield Dr
- LOT W Copperfield Dr
- 0 W Copperfield Dr
- LOT 48 W Copperfield Dr
- LOT 47 W Copperfield Dr
- LOT 3 W Copperfield Dr
- LOT 2 W Copperfield Dr
- LOT 59 W Copperfield Dr
- LOT 1 W Copperfield Dr
- LOT 49 W Copperfield Dr
- 509 W Copperfield Dr
- 417 W Copperfield Dr
- 732 S Prairieview Dr
- 409 W Copperfield Dr
- 728 S Prairieview Dr
Your Personal Tour Guide
Ask me questions while you tour the home.