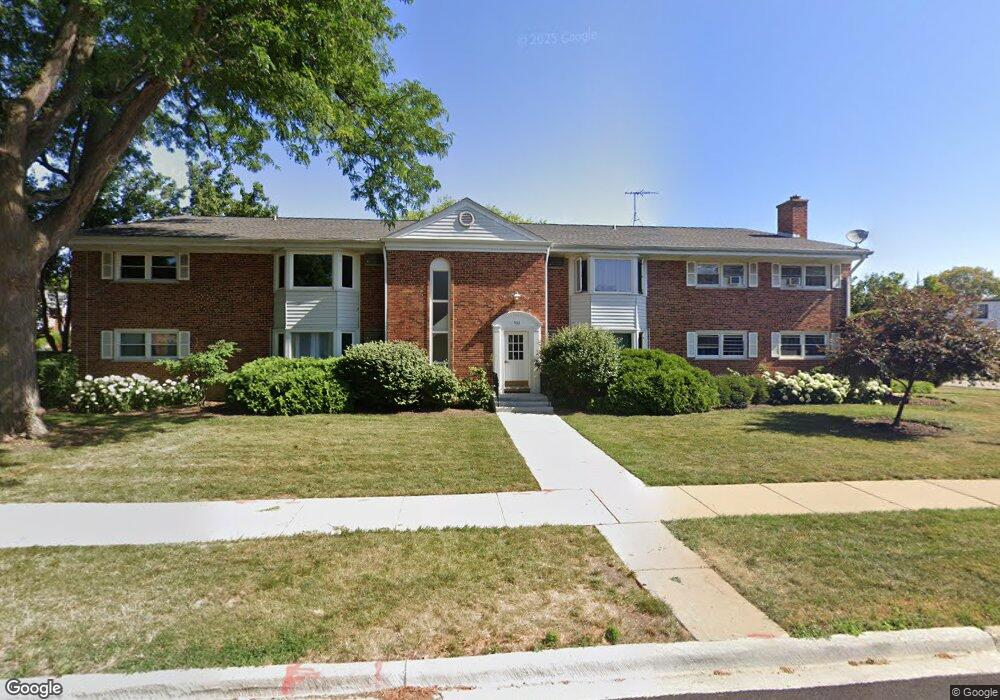
502 W Miner St Unit 5021B Arlington Heights, IL 60005
Arlington Heights Central Business District NeighborhoodEstimated Value: $202,345 - $235,000
2
Beds
1
Bath
1,000
Sq Ft
$216/Sq Ft
Est. Value
About This Home
This home is located at 502 W Miner St Unit 5021B, Arlington Heights, IL 60005 and is currently estimated at $216,086, approximately $216 per square foot. 502 W Miner St Unit 5021B is a home located in Cook County with nearby schools including Westgate Elementary School, South Middle School, and Rolling Meadows High School.
Ownership History
Date
Name
Owned For
Owner Type
Purchase Details
Closed on
Dec 4, 2024
Sold by
Shah Manush and Shah Krishma M
Bought by
Nathaniam Family Trust and Shah
Current Estimated Value
Purchase Details
Closed on
May 24, 2021
Sold by
Jones Nicholas Michael and Jones Kathryn Lenore
Bought by
Shah Manush
Home Financials for this Owner
Home Financials are based on the most recent Mortgage that was taken out on this home.
Original Mortgage
$110,625
Interest Rate
3.37%
Mortgage Type
New Conventional
Purchase Details
Closed on
Dec 28, 2010
Sold by
Jones Nicholas and Jones Kathryn
Bought by
Jones Nicholas Michael and Jones Kathryn Lenore
Purchase Details
Closed on
Oct 25, 2004
Sold by
Legler Mary Pat
Bought by
Jones Nicholas and Jones Kathryn
Home Financials for this Owner
Home Financials are based on the most recent Mortgage that was taken out on this home.
Original Mortgage
$125,600
Interest Rate
5%
Mortgage Type
Purchase Money Mortgage
Purchase Details
Closed on
Dec 1, 2000
Sold by
Swank Sunseri Sandra
Bought by
Legler Mary Pat
Create a Home Valuation Report for This Property
The Home Valuation Report is an in-depth analysis detailing your home's value as well as a comparison with similar homes in the area
Home Values in the Area
Average Home Value in this Area
Purchase History
| Date | Buyer | Sale Price | Title Company |
|---|---|---|---|
| Nathaniam Family Trust | -- | None Listed On Document | |
| Nathaniam Family Trust | -- | None Listed On Document | |
| Shah Manush | $147,500 | Chicago Title | |
| Jones Nicholas Michael | -- | None Available | |
| Jones Nicholas | $157,000 | Atgf Inc | |
| Legler Mary Pat | $89,000 | -- |
Source: Public Records
Mortgage History
| Date | Status | Borrower | Loan Amount |
|---|---|---|---|
| Previous Owner | Shah Manush | $110,625 | |
| Previous Owner | Jones Nicholas | $125,600 |
Source: Public Records
Tax History Compared to Growth
Tax History
| Year | Tax Paid | Tax Assessment Tax Assessment Total Assessment is a certain percentage of the fair market value that is determined by local assessors to be the total taxable value of land and additions on the property. | Land | Improvement |
|---|---|---|---|---|
| 2024 | $3,845 | $14,046 | $2,145 | $11,901 |
| 2023 | $3,703 | $14,046 | $2,145 | $11,901 |
| 2022 | $3,703 | $14,046 | $2,145 | $11,901 |
| 2021 | $3,420 | $11,361 | $268 | $11,093 |
| 2020 | $3,331 | $11,361 | $268 | $11,093 |
| 2019 | $3,315 | $12,626 | $268 | $12,358 |
| 2018 | $3,140 | $10,759 | $214 | $10,545 |
| 2017 | $3,103 | $10,759 | $214 | $10,545 |
| 2016 | $2,894 | $10,759 | $214 | $10,545 |
| 2015 | $2,494 | $8,447 | $1,018 | $7,429 |
| 2014 | $2,421 | $8,447 | $1,018 | $7,429 |
| 2013 | $2,360 | $8,447 | $1,018 | $7,429 |
Source: Public Records
Map
Nearby Homes
- 514 W Miner St Unit 2F
- 354 W Miner St Unit 3A
- 338 W Miner St Unit 1A
- 318 W Wing St
- 314 W Wing St
- 151 W Wing St Unit 301
- 214 W Fremont St
- 44 N Vail Ave Unit 205
- 1 S Highland Ave Unit 400
- 1 S Highland Ave Unit 800
- 201 N Vail Ave Unit 305
- 105 S Mitchell Ave
- 24 S Kaspar Ave
- 105 S Vail Ave
- 1108 W Miner St
- 121 S Vail Ave Unit 403
- 121 S Vail Ave Unit 401
- 827 N Walnut Ave
- 32 N Belmont Ave
- 1302 W Campbell St
- 502 W Miner St Unit 2B
- 502 W Miner St Unit 5022C
- 502 W Miner St Unit 5021C
- 502 W Miner St Unit 5022A
- 502 W Miner St Unit 5021A
- 502 W Miner St Unit 5022B
- 502 W Miner St Unit 5021D
- 502 W Miner St Unit 5022D
- 502 W Miner St Unit 1C
- 502 W Miner St Unit 1B
- 502 W Miner St Unit 2A
- 502 W Miner St Unit 1D
- 502 W Miner St Unit 1A
- 502 W Miner St
- 502 W Miner St Unit 2C
- 502 W Miner St Unit 2D
- 216 N Somerset Ln Unit 2161H
- 216 N Somerset Ln Unit 2162H
- 216 N Somerset Ln Unit 2161K
- 216 N Somerset Ln Unit 2162G