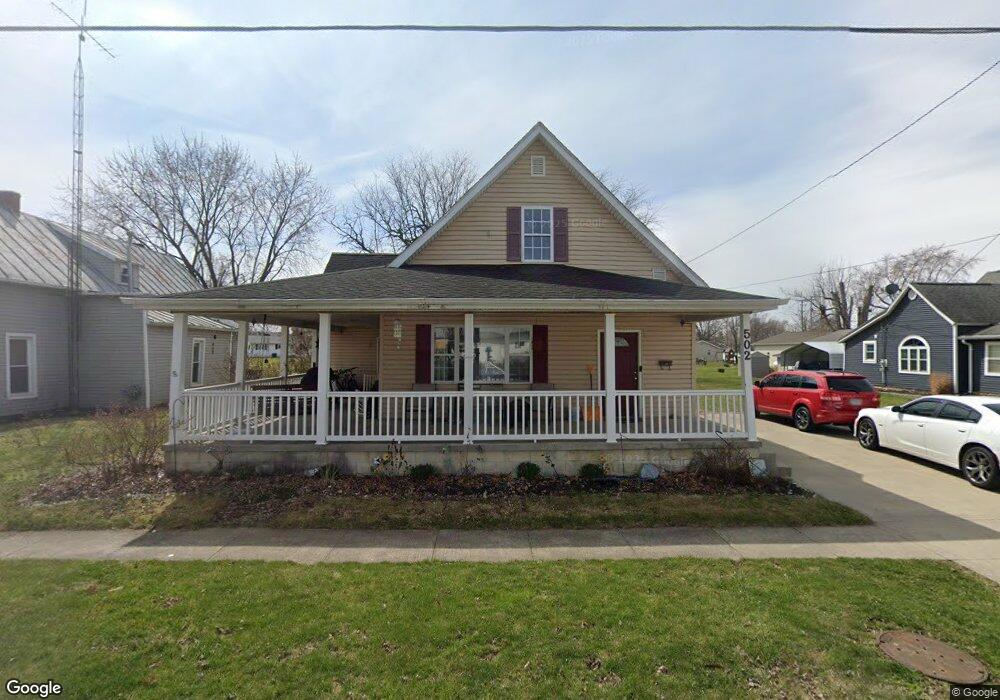
502 W Sycamore St Columbus Grove, OH 45830
Estimated Value: $184,000 - $232,000
--
Bed
2
Baths
1,734
Sq Ft
$122/Sq Ft
Est. Value
About This Home
This home is located at 502 W Sycamore St, Columbus Grove, OH 45830 and is currently estimated at $211,104, approximately $121 per square foot. 502 W Sycamore St is a home located in Putnam County with nearby schools including Columbus Grove Elementary School, Columbus Grove Middle School, and Columbus Grove High School.
Ownership History
Date
Name
Owned For
Owner Type
Purchase Details
Closed on
Feb 21, 2020
Sold by
Edwards Bart Alan and Edwards Debra Ann
Bought by
Kozlowski Douglas
Current Estimated Value
Home Financials for this Owner
Home Financials are based on the most recent Mortgage that was taken out on this home.
Original Mortgage
$115,893
Outstanding Balance
$102,906
Interest Rate
3.75%
Mortgage Type
FHA
Estimated Equity
$108,198
Purchase Details
Closed on
Nov 23, 2005
Sold by
Beutler Amiee Jean
Bought by
Edwards Bart Alan
Create a Home Valuation Report for This Property
The Home Valuation Report is an in-depth analysis detailing your home's value as well as a comparison with similar homes in the area
Home Values in the Area
Average Home Value in this Area
Purchase History
| Date | Buyer | Sale Price | Title Company |
|---|---|---|---|
| Kozlowski Douglas | $134,000 | None Available | |
| Edwards Bart Alan | -- | None Available |
Source: Public Records
Mortgage History
| Date | Status | Borrower | Loan Amount |
|---|---|---|---|
| Open | Kozlowski Douglas | $115,893 |
Source: Public Records
Tax History Compared to Growth
Tax History
| Year | Tax Paid | Tax Assessment Tax Assessment Total Assessment is a certain percentage of the fair market value that is determined by local assessors to be the total taxable value of land and additions on the property. | Land | Improvement |
|---|---|---|---|---|
| 2024 | $1,764 | $52,470 | $5,220 | $47,250 |
| 2023 | $1,867 | $40,230 | $4,080 | $36,150 |
| 2022 | $1,645 | $40,233 | $4,081 | $36,152 |
| 2021 | $1,564 | $40,230 | $4,080 | $36,150 |
| 2020 | $1,566 | $40,080 | $3,650 | $36,430 |
| 2019 | $1,537 | $40,230 | $4,080 | $36,150 |
| 2018 | $1,535 | $40,230 | $4,080 | $36,150 |
| 2017 | $1,548 | $40,230 | $4,080 | $36,150 |
| 2016 | $1,511 | $40,080 | $3,650 | $36,430 |
| 2015 | $1,518 | $40,080 | $3,650 | $36,430 |
| 2014 | $1,534 | $40,080 | $3,650 | $36,430 |
| 2013 | $1,532 | $40,080 | $3,650 | $36,430 |
Source: Public Records
Map
Nearby Homes
- 209 Willow Bend Dr
- 205 S Broadway St
- 204 S Broadway St
- 308 Delphos Rd
- 11059 Ottawa Rd
- 147 Elm St
- 148 S Water St
- 704 Sherman St
- 17429 Road 5
- 208 E Monroe St
- 101 Maplewood Dr
- 15105 Road 15m
- 00000 Ohio 696
- 000 Ohio 696
- 0000 Ohio 696
- 8160 Columbus Grove-Bluffton Rd
- 6585 Ottawa Rd
- 201 Wall St
- 309 Wall St
- 220 Parklane Dr