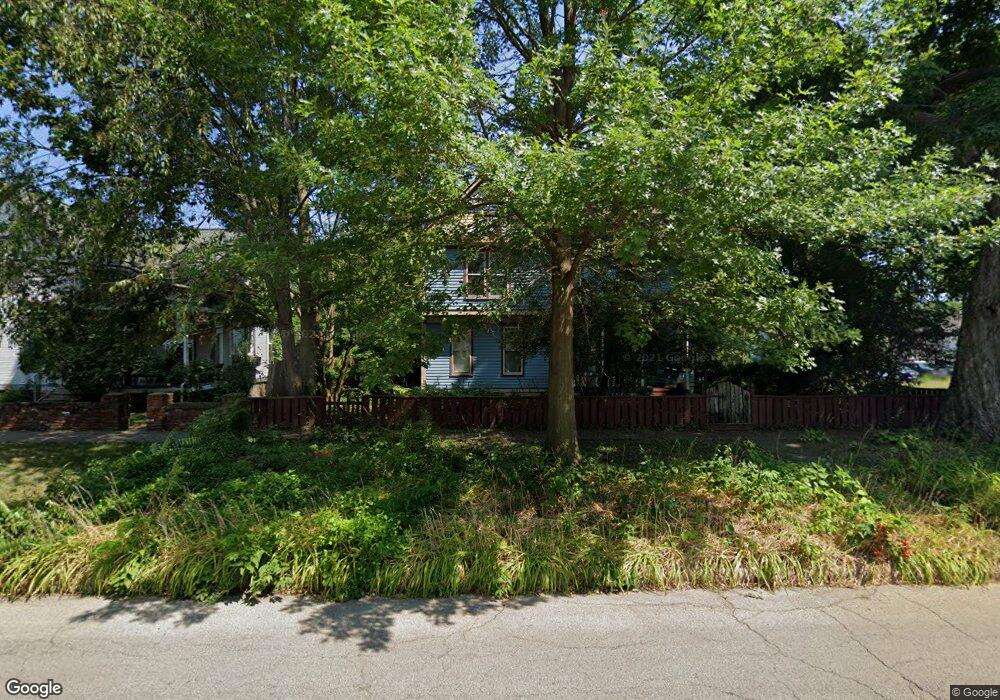
502 W Washington St Champaign, IL 61820
Estimated Value: $190,000 - $220,000
--
Bed
2
Baths
932
Sq Ft
$222/Sq Ft
Est. Value
About This Home
This home is located at 502 W Washington St, Champaign, IL 61820 and is currently estimated at $206,814, approximately $221 per square foot. 502 W Washington St is a home located in Champaign County with nearby schools including Central High School, Franklin STEAM Academy, and Holy Cross Elementary School.
Ownership History
Date
Name
Owned For
Owner Type
Purchase Details
Closed on
Nov 2, 2021
Sold by
Ctehng David and Ctehng David Kim
Bought by
Clark Scott
Current Estimated Value
Home Financials for this Owner
Home Financials are based on the most recent Mortgage that was taken out on this home.
Original Mortgage
$157,102
Outstanding Balance
$144,215
Interest Rate
3.12%
Mortgage Type
FHA
Estimated Equity
$62,599
Purchase Details
Closed on
Sep 9, 2009
Sold by
Wagner Ursula Catherine
Bought by
Tcheng David Kim
Purchase Details
Closed on
Aug 7, 2006
Sold by
Drda Darrin J
Bought by
Tcheng David Kim and Wagner Ursula Catherine
Home Financials for this Owner
Home Financials are based on the most recent Mortgage that was taken out on this home.
Original Mortgage
$131,300
Interest Rate
6.82%
Mortgage Type
Purchase Money Mortgage
Create a Home Valuation Report for This Property
The Home Valuation Report is an in-depth analysis detailing your home's value as well as a comparison with similar homes in the area
Home Values in the Area
Average Home Value in this Area
Purchase History
| Date | Buyer | Sale Price | Title Company |
|---|---|---|---|
| Clark Scott | $160,000 | Act | |
| Tcheng David Kim | -- | None Available | |
| Tcheng David Kim | $150,000 | None Available |
Source: Public Records
Mortgage History
| Date | Status | Borrower | Loan Amount |
|---|---|---|---|
| Open | Clark Scott | $157,102 | |
| Previous Owner | Tcheng David Kim | $131,300 |
Source: Public Records
Tax History Compared to Growth
Tax History
| Year | Tax Paid | Tax Assessment Tax Assessment Total Assessment is a certain percentage of the fair market value that is determined by local assessors to be the total taxable value of land and additions on the property. | Land | Improvement |
|---|---|---|---|---|
| 2024 | $4,403 | $60,200 | $7,870 | $52,330 |
| 2023 | $4,403 | $54,830 | $7,170 | $47,660 |
| 2022 | $4,100 | $50,580 | $6,610 | $43,970 |
| 2021 | $3,990 | $49,590 | $6,480 | $43,110 |
| 2020 | $3,821 | $47,680 | $6,230 | $41,450 |
| 2019 | $3,688 | $46,700 | $6,100 | $40,600 |
| 2018 | $3,596 | $45,960 | $6,000 | $39,960 |
| 2017 | $3,451 | $44,190 | $5,770 | $38,420 |
| 2016 | $3,084 | $43,280 | $5,650 | $37,630 |
| 2015 | $3,098 | $42,510 | $5,550 | $36,960 |
| 2014 | $3,071 | $42,510 | $5,550 | $36,960 |
| 2013 | $3,044 | $42,510 | $5,550 | $36,960 |
Source: Public Records
Map
Nearby Homes
- 305 N Prairie St Unit 7
- 410 N State St Unit 15
- 410 N State St Unit 4
- 708 W Church St
- 405 W University Ave Unit 102
- 305 W University Ave Unit 4
- 603 W Clark St
- 301 N Neil St Unit 808-809
- 301 N Neil St Unit 702
- 301 N Neil St Unit 606
- 301 N Neil St Unit 909
- 301 N Neil St Unit 609
- 402 W Eureka St
- 403 W Beardsley Ave
- 501 N Prospect Ave
- 211 W Beardsley Ave
- 1003 N Randolph St
- 704 W White St
- 401 W Bradley Ave
- 907 W Church St
- 503 N Elm St
- 504 W Washington St
- 412 W Washington St
- 412 W Washington St Unit 1
- 412 W Washington St Unit 3
- 506 W Washington St
- 409 N Elm St
- 505 N Elm St
- 508 W Washington St
- 503 W Washington St
- 407 N Elm St
- 506 N Elm St
- 503 W Columbia Ave
- 410 N Elm St
- 410 W Washington St
- 505 W Washington St
- 507 N Elm St
- 505 W Columbia Ave
- 507 W Washington St
- 405 N Elm St