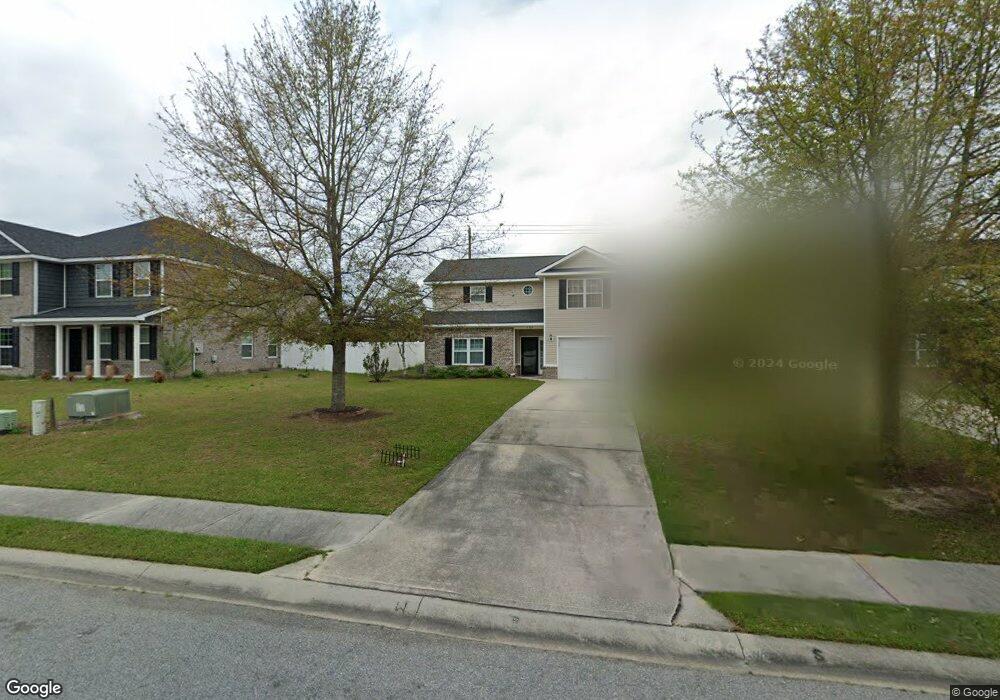
502 Westminster Ct Rincon, GA 31326
Estimated Value: $230,557 - $271,000
Studio
1
Bath
1,556
Sq Ft
$157/Sq Ft
Est. Value
About This Home
This home is located at 502 Westminster Ct, Rincon, GA 31326 and is currently estimated at $244,639, approximately $157 per square foot. 502 Westminster Ct is a home located in Effingham County with nearby schools including Blandford Elementary School, Ebenezer Middle School, and Effingham County High School.
Ownership History
Date
Name
Owned For
Owner Type
Purchase Details
Closed on
Aug 4, 2021
Sold by
Franklin Pamela H
Bought by
Chiang Shin Ying
Current Estimated Value
Home Financials for this Owner
Home Financials are based on the most recent Mortgage that was taken out on this home.
Original Mortgage
$121,500
Outstanding Balance
$109,763
Interest Rate
2.9%
Mortgage Type
New Conventional
Estimated Equity
$134,876
Purchase Details
Closed on
Nov 20, 2006
Sold by
Darwin Easley Construction
Bought by
Franklin Pamela H
Home Financials for this Owner
Home Financials are based on the most recent Mortgage that was taken out on this home.
Original Mortgage
$102,700
Interest Rate
6.33%
Mortgage Type
New Conventional
Purchase Details
Closed on
May 19, 2005
Sold by
Affordable Home Builders I
Bought by
Darwin Beasley Construction Co
Create a Home Valuation Report for This Property
The Home Valuation Report is an in-depth analysis detailing your home's value as well as a comparison with similar homes in the area
Home Values in the Area
Average Home Value in this Area
Purchase History
| Date | Buyer | Sale Price | Title Company |
|---|---|---|---|
| Chiang Shin Ying | $164,500 | -- | |
| Franklin Pamela H | $128,400 | -- | |
| Darwin Beasley Construction Co | $50,000 | -- |
Source: Public Records
Mortgage History
| Date | Status | Borrower | Loan Amount |
|---|---|---|---|
| Open | Chiang Shin Ying | $121,500 | |
| Previous Owner | Franklin Pamela H | $102,700 | |
| Previous Owner | Franklin Pamela H | $25,700 | |
| Closed | Darwin Beasley Construction Co | $0 |
Source: Public Records
Tax History
| Year | Tax Paid | Tax Assessment Tax Assessment Total Assessment is a certain percentage of the fair market value that is determined by local assessors to be the total taxable value of land and additions on the property. | Land | Improvement |
|---|---|---|---|---|
| 2025 | $2,511 | $91,221 | $13,000 | $78,221 |
| 2024 | $2,511 | $79,461 | $13,000 | $66,461 |
| 2023 | $1,487 | $61,009 | $13,000 | $48,009 |
| 2022 | $1,606 | $61,009 | $13,000 | $48,009 |
| 2021 | $1,406 | $57,386 | $9,400 | $47,986 |
| 2020 | $1,452 | $52,742 | $7,400 | $45,342 |
| 2019 | $1,430 | $52,742 | $7,400 | $45,342 |
| 2018 | $1,263 | $47,972 | $6,000 | $41,972 |
| 2017 | $1,126 | $42,468 | $780 | $41,688 |
| 2016 | $1,162 | $43,463 | $2,080 | $41,383 |
| 2015 | $1,334 | $49,183 | $7,800 | $41,383 |
| 2014 | $1,133 | $41,803 | $420 | $41,383 |
| 2013 | -- | $41,803 | $420 | $41,383 |
Source: Public Records
Map
Nearby Homes
- 208 Market St
- 427 Seabreeze Dr
- 512 Windsong Dr
- 124 Tolliver Ln
- 233 Jasper Ln
- 225 Jasper Ln
- 112 Karima Cir
- 235 Saint Andrews Rd
- 219 Jasper Ln
- 211 Quartz Dr
- 317 St Andrews Rd
- 10 Michelle Ct
- 136 Fraser Ln
- 107 Stonewalk Dr
- 114 Stonewalk Dr
- 417 Keiffer Dr
- 22 Grove Hollow Rd
- 44 Grove Hollow Rd
- 19 Grove Hollow Rd
- 28 Grove Hollow Rd
- 504 Westminster Ct
- 506 Westminster Ct
- 100 Tolliver Ln
- 508 Westminster Ct
- 510 Westminster Ct
- 600 Heathcliff Ct
- 199 Market St
- 101 Tolliver Ln
- 512 Westminster Ct
- 602 Heathcliff Ct
- 209 Windsong Dr
- 514 Westminster Ct
- 102 Tolliver Ln
- 604 Heathcliff Ct
- 516 Westminster Ct
- 201 Market St
- 208 Windsong Dr
- 606 Heathcliff Ct
- 206 Windsong Dr
- 103 Tolliver Ln
Your Personal Tour Guide
Ask me questions while you tour the home.