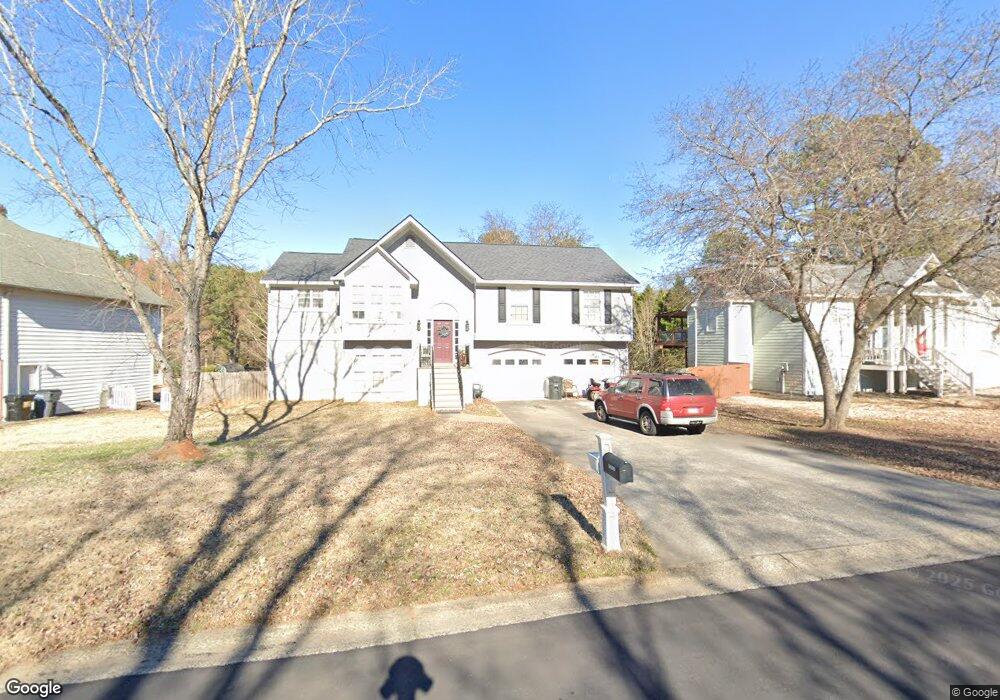
5020 Sunbrook Way NW Acworth, GA 30101
Estimated Value: $385,470 - $456,000
4
Beds
3
Baths
1,708
Sq Ft
$248/Sq Ft
Est. Value
About This Home
This home is located at 5020 Sunbrook Way NW, Acworth, GA 30101 and is currently estimated at $424,118, approximately $248 per square foot. 5020 Sunbrook Way NW is a home located in Cobb County with nearby schools including Frey Elementary School, Durham Middle School, and Allatoona High School.
Ownership History
Date
Name
Owned For
Owner Type
Purchase Details
Closed on
Jun 30, 2005
Sold by
Kraut Joseph W
Bought by
Taylor Kathleen E
Current Estimated Value
Home Financials for this Owner
Home Financials are based on the most recent Mortgage that was taken out on this home.
Original Mortgage
$180,000
Outstanding Balance
$93,537
Interest Rate
5.59%
Estimated Equity
$330,581
Purchase Details
Closed on
Oct 24, 2000
Sold by
Obidowski Josiane E
Bought by
Sutton Jacqueline Y
Home Financials for this Owner
Home Financials are based on the most recent Mortgage that was taken out on this home.
Original Mortgage
$165,000
Interest Rate
7.91%
Mortgage Type
New Conventional
Purchase Details
Closed on
Jan 5, 1994
Sold by
Lowden Land Co
Bought by
Obidowski Edmond J
Home Financials for this Owner
Home Financials are based on the most recent Mortgage that was taken out on this home.
Original Mortgage
$62,000
Interest Rate
7.13%
Create a Home Valuation Report for This Property
The Home Valuation Report is an in-depth analysis detailing your home's value as well as a comparison with similar homes in the area
Home Values in the Area
Average Home Value in this Area
Purchase History
| Date | Buyer | Sale Price | Title Company |
|---|---|---|---|
| Taylor Kathleen E | $180,000 | -- | |
| Sutton Jacqueline Y | $165,000 | -- | |
| Obidowski Edmond J | $129,900 | -- |
Source: Public Records
Mortgage History
| Date | Status | Borrower | Loan Amount |
|---|---|---|---|
| Open | Taylor Kathleen E | $180,000 | |
| Previous Owner | Sutton Jacqueline Y | $165,000 | |
| Previous Owner | Obidowski Edmond J | $62,000 |
Source: Public Records
Tax History Compared to Growth
Tax History
| Year | Tax Paid | Tax Assessment Tax Assessment Total Assessment is a certain percentage of the fair market value that is determined by local assessors to be the total taxable value of land and additions on the property. | Land | Improvement |
|---|---|---|---|---|
| 2024 | $1,070 | $157,164 | $36,000 | $121,164 |
| 2023 | $832 | $146,340 | $34,000 | $112,340 |
| 2022 | $951 | $117,140 | $22,000 | $95,140 |
| 2021 | $905 | $102,044 | $22,000 | $80,044 |
| 2020 | $905 | $102,044 | $22,000 | $80,044 |
| 2019 | $852 | $84,120 | $22,000 | $62,120 |
| 2018 | $852 | $84,120 | $22,000 | $62,120 |
| 2017 | $625 | $70,292 | $12,000 | $58,292 |
| 2016 | $626 | $70,292 | $12,000 | $58,292 |
| 2015 | $437 | $48,100 | $14,000 | $34,100 |
| 2014 | $447 | $48,100 | $0 | $0 |
Source: Public Records
Map
Nearby Homes
- 5046 Sunbrook Dr NW
- 0 Mars Hill Rd Unit 7657672
- 2295 Inverwood Dr NW
- 4544 Cavallon Way NW
- 2316 Fripp Overlook NW
- 4525 Cavallon Way NW
- 4790 Galloways Farm Ln NW
- 5087 Dillingham Dr NW
- 4902 Pleasantry Way NW
- 5153 Elkins Ln NW
- 5105 Dillingham Dr NW
- 4467 Sterling Pointe Dr NW
- 4980 Pleasantry Way NW
- 4980 Newpark Ln NW Unit 2
- 4973 Newpark Ln NW
- 5116 Barton Pass NW
- 4547 Meadow Green Ln NW
- 0 Sunbrook Way NW Unit 8645398
- 0 Sunbrook Way NW Unit 8219314
- 0 Sunbrook Way NW Unit 8149999
- 0 Sunbrook Way NW Unit 8878781
- 0 Sunbrook Way NW Unit 7214576
- 0 Sunbrook Way NW
- 5022 Sunbrook Way NW
- 5018 Sunbrook Way NW
- 5015 Sunbrook Way NW
- 5024 Sunbrook Way NW
- 5016 Sunbrook Way NW
- 2266 Sunbrook Trail NW
- 5014 Sunbrook Way NW
- 5017 Sunbrook Way NW
- 5026 Sunbrook Way NW
- 2265 Sunbrook Trail NW
- 5011 Sunbrook Way NW
- 5043 Sunbrook Dr NW
- 5012 Sunbrook Way NW
- 2264 Sunbrook Trail NW