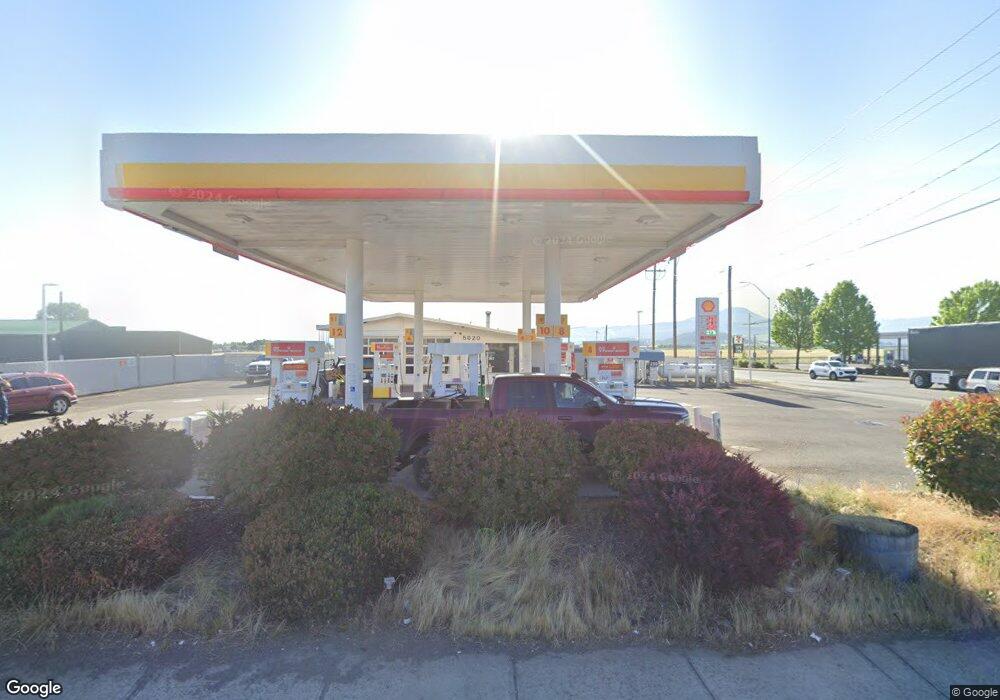
5020 Table Rock Rd Central Point, OR 97502
Estimated Value: $389,364
Studio
--
Bath
975
Sq Ft
$399/Sq Ft
Est. Value
About This Home
This home is located at 5020 Table Rock Rd, Central Point, OR 97502 and is currently priced at $389,364, approximately $399 per square foot. 5020 Table Rock Rd is a home located in Jackson County with nearby schools including Sams Valley Elementary School, Scenic Middle School, and Crater High School.
Ownership History
Date
Name
Owned For
Owner Type
Purchase Details
Closed on
Oct 12, 2023
Sold by
Leathers Limited Partnership
Bought by
Erssa Holdings Oregon Llc
Current Estimated Value
Home Financials for this Owner
Home Financials are based on the most recent Mortgage that was taken out on this home.
Original Mortgage
$35,100,000
Outstanding Balance
$34,289,031
Interest Rate
7.18%
Mortgage Type
New Conventional
Purchase Details
Closed on
Dec 14, 2010
Sold by
Leathers Limited Partnership Iii
Bought by
Leathers Limited Partnership
Purchase Details
Closed on
Dec 14, 2006
Sold by
Leathers Lp Ii
Bought by
Leathers Lp Iii
Purchase Details
Closed on
Dec 21, 2000
Sold by
Oxford Daniel A Trustee Fbo
Bought by
Oxford Family Llc
Purchase Details
Closed on
Feb 18, 1999
Sold by
Leathers Ltd Partnership
Bought by
Leathers Ltd Partnership Ii
Create a Home Valuation Report for This Property
The Home Valuation Report is an in-depth analysis detailing your home's value as well as a comparison with similar homes in the area
Purchase History
| Date | Buyer | Sale Price | Title Company |
|---|---|---|---|
| Erssa Holdings Oregon Llc | $384,080 | First American Title | |
| Leathers Limited Partnership | -- | None Available | |
| Leathers Lp Iii | -- | None Available | |
| Oxford Family Llc | -- | -- | |
| Leathers Ltd Partnership Ii | -- | -- |
Source: Public Records
Mortgage History
| Date | Status | Borrower | Loan Amount |
|---|---|---|---|
| Open | Erssa Holdings Oregon Llc | $35,100,000 |
Source: Public Records
Tax History
| Year | Tax Paid | Tax Assessment Tax Assessment Total Assessment is a certain percentage of the fair market value that is determined by local assessors to be the total taxable value of land and additions on the property. | Land | Improvement |
|---|---|---|---|---|
| 2026 | $6,010 | $419,680 | -- | -- |
| 2025 | $5,693 | $391,190 | $128,280 | $262,910 |
| 2024 | $5,693 | $391,190 | $128,280 | $262,910 |
| 2023 | $5,785 | $384,080 | $125,950 | $258,130 |
| 2022 | $5,619 | $384,080 | $125,950 | $258,130 |
| 2021 | $5,406 | $369,310 | $121,100 | $248,210 |
| 2020 | $4,589 | $312,970 | $102,630 | $210,340 |
| 2019 | $4,624 | $312,970 | $102,630 | $210,340 |
| 2018 | $4,617 | $289,790 | $95,020 | $194,770 |
| 2017 | $4,290 | $289,790 | $95,020 | $194,770 |
| 2016 | $4,363 | $286,020 | $91,390 | $194,630 |
| 2015 | $4,393 | $291,990 | $93,270 | $198,720 |
| 2014 | $4,409 | $291,990 | $93,270 | $198,720 |
Source: Public Records
Map
Nearby Homes
- 2460 Jeremy St
- 875 N Mountain Ave
- 4595 Table Rock Rd
- 225 Wilson Rd
- 4399 Table Rock Rd
- 446 Beebe Rd
- 1409 Twin Rocks Dr
- 201 Orchardview Cir
- 4824 Airway Dr Unit 371W06BB410
- 4922 Gebhard Rd
- 4404 Biddle Rd
- 1653 Kentucky Ct
- 1121 Annalise St
- 1113 Annalise St
- 4251 Table Rock Rd
- 1109 Annalise St
- 4286 Hamrick Rd
- 4726 Gebhard Rd
- 4722 Gebhard Rd
- 4601 Biddle Rd Unit C
- 5022 Table Rock Rd
- 37 E Vilas Rd
- 5050 Table Rock Rd
- 15 W Vilas Rd
- 0 Evilas Rd Unit 15164201
- 5077 Table Rock Rd
- 4921 Table Rock Rd
- 77 W Vilas Rd
- 52 W Vilas Rd
- 203 Wells Rd
- 234 Wells Rd
- 4913 Table Rock Rd
- 94 W Vilas Rd
- 77 Woods Rd
- 204 Wells Rd
- 206 Wells Rd
- 8602 Table Rock Rd
- 3332 Table Rock Rd
- 106 W Vilas Rd
- 5134 Table Rock Rd
Your Personal Tour Guide
Ask me questions while you tour the home.