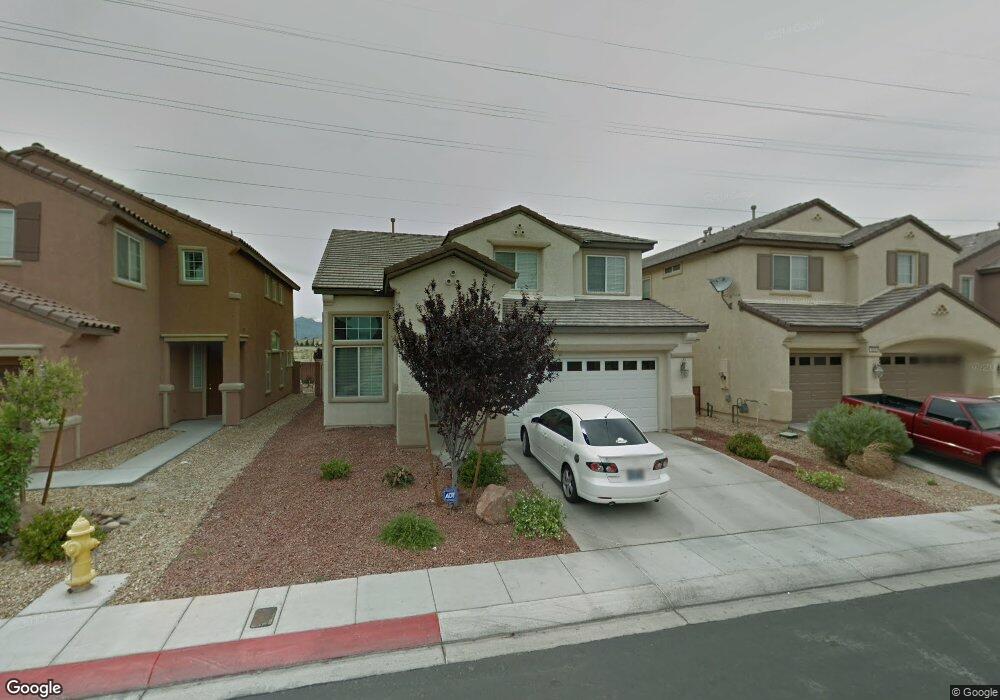
5021 Blue Rose St Unit 3 North Las Vegas, NV 89081
Northridge NeighborhoodEstimated Value: $443,226 - $465,000
4
Beds
3
Baths
2,442
Sq Ft
$188/Sq Ft
Est. Value
About This Home
This home is located at 5021 Blue Rose St Unit 3, North Las Vegas, NV 89081 and is currently estimated at $458,807, approximately $187 per square foot. 5021 Blue Rose St Unit 3 is a home located in Clark County with nearby schools including Jesse D. Scott Elementary School, Clifford O. Findlay Middle School, and Mojave High School.
Ownership History
Date
Name
Owned For
Owner Type
Purchase Details
Closed on
Jan 24, 2011
Sold by
Vegas International Llc
Bought by
Williams Brian
Current Estimated Value
Home Financials for this Owner
Home Financials are based on the most recent Mortgage that was taken out on this home.
Original Mortgage
$143,010
Outstanding Balance
$97,112
Interest Rate
4.62%
Mortgage Type
VA
Estimated Equity
$361,695
Purchase Details
Closed on
Oct 27, 2010
Sold by
Anderson Alonzo
Bought by
Vegas International Llc
Purchase Details
Closed on
Sep 25, 2006
Sold by
Us Home Corp
Bought by
Anderson Alonzo
Home Financials for this Owner
Home Financials are based on the most recent Mortgage that was taken out on this home.
Original Mortgage
$244,450
Interest Rate
7.12%
Mortgage Type
Unknown
Purchase Details
Closed on
May 10, 2006
Sold by
Celebrate Holdings Llc
Bought by
Us Home Corp
Create a Home Valuation Report for This Property
The Home Valuation Report is an in-depth analysis detailing your home's value as well as a comparison with similar homes in the area
Home Values in the Area
Average Home Value in this Area
Purchase History
| Date | Buyer | Sale Price | Title Company |
|---|---|---|---|
| Williams Brian | $140,000 | Noble Title | |
| Vegas International Llc | $113,600 | Lsi Title Company | |
| Anderson Alonzo | $305,602 | North American Title Co | |
| Us Home Corp | $2,682,648 | North American Title Co |
Source: Public Records
Mortgage History
| Date | Status | Borrower | Loan Amount |
|---|---|---|---|
| Open | Williams Brian | $143,010 | |
| Previous Owner | Anderson Alonzo | $244,450 |
Source: Public Records
Tax History Compared to Growth
Tax History
| Year | Tax Paid | Tax Assessment Tax Assessment Total Assessment is a certain percentage of the fair market value that is determined by local assessors to be the total taxable value of land and additions on the property. | Land | Improvement |
|---|---|---|---|---|
| 2025 | $2,119 | $138,268 | $36,050 | $102,218 |
| 2024 | $938 | $138,268 | $36,050 | $102,218 |
| 2023 | $938 | $130,190 | $33,950 | $96,240 |
| 2022 | $965 | $114,071 | $26,250 | $87,821 |
| 2021 | $961 | $100,464 | $25,550 | $74,914 |
| 2020 | $1,881 | $92,120 | $23,800 | $68,320 |
| 2019 | $1,763 | $89,996 | $20,300 | $69,696 |
| 2018 | $1,682 | $78,030 | $16,100 | $61,930 |
| 2017 | $2,421 | $72,062 | $15,750 | $56,312 |
| 2016 | $1,575 | $60,089 | $10,500 | $49,589 |
| 2015 | $1,571 | $56,257 | $10,500 | $45,757 |
| 2014 | $1,525 | $47,519 | $7,000 | $40,519 |
Source: Public Records
Map
Nearby Homes
- 5025 Blue Rose St
- 2213 Dale Bumpers Ct
- 5116 Blue Rose St
- 4847 Kinworthy St
- 1413 Fantastic Ct
- 1512 Groom Ave
- 1405 Fantastic Ct
- 5217 Grand Lake St
- 5220 Pendergrass St
- 1214 Emerald Stone Ave
- 4746 Roby Grey Way
- 5253 Pendergrass St
- 4848 Cutting Diamond Ct
- 1022 Cliffbrook Hedge Ave Unit 3
- 1408 Laughing Larkspur Ave
- 1014 Cliffbrook Hedge Ave
- 1014 Emerald Stone Ave
- 1014 Edgestone Mark Ave
- 1106 Granite Ash Ave
- 1109 Jewel Springs Ln
- 5017 Blue Rose St
- 5013 Blue Rose St
- 5029 Blue Rose St
- 5033 Blue Rose St
- 5020 Blue Rose St
- 5016 Blue Rose St
- 5024 Blue Rose St
- 5012 Blue Rose St
- 5028 Blue Rose St
- 5037 Blue Rose St
- 5005 Blue Rose St
- 5005 Blue Rose St Unit n
- 5008 Blue Rose St
- 5008 Blue Rose St
- 5008 Blue Rose St
- 5032 Blue Rose St
- 5041 Blue Rose St
- 5036 Blue Rose St
- 0 E La Madre Way