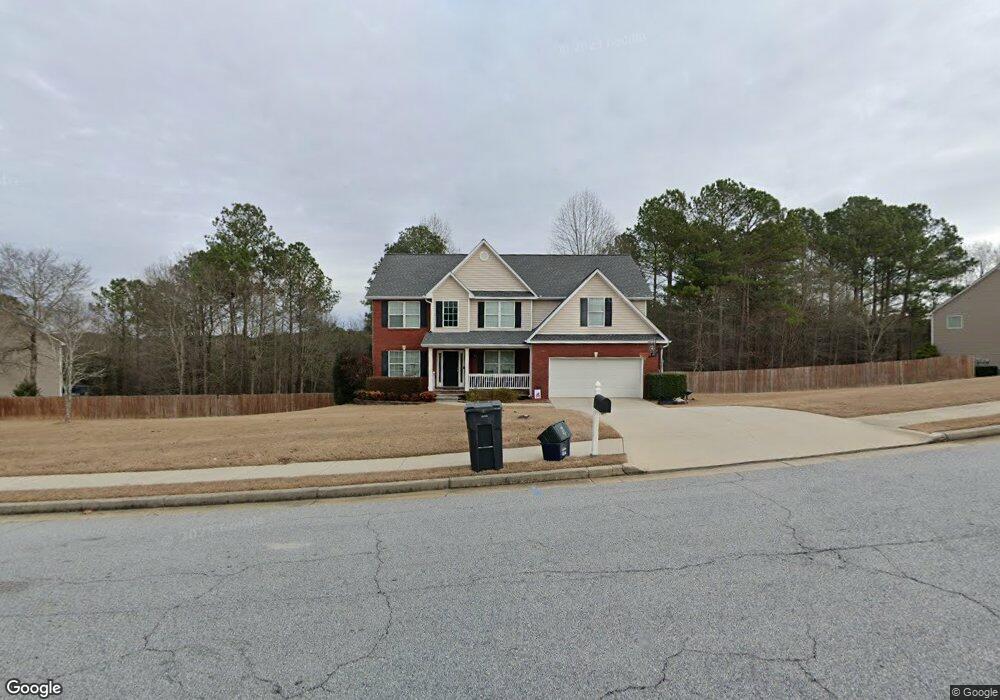
5021 Brookstone Ln Loganville, GA 30052
Walnut Grove NeighborhoodEstimated Value: $461,377 - $501,000
5
Beds
3
Baths
2,844
Sq Ft
$167/Sq Ft
Est. Value
About This Home
This home is located at 5021 Brookstone Ln, Loganville, GA 30052 and is currently estimated at $475,594, approximately $167 per square foot. 5021 Brookstone Ln is a home located in Walton County with nearby schools including Walnut Grove Elementary School, Youth Middle School, and Walnut Grove High School.
Ownership History
Date
Name
Owned For
Owner Type
Purchase Details
Closed on
Feb 9, 2010
Sold by
Federal Home Loan Mortgage Corporation
Bought by
Stewart Joseph M and Stewart Daphnee
Current Estimated Value
Home Financials for this Owner
Home Financials are based on the most recent Mortgage that was taken out on this home.
Original Mortgage
$162,011
Outstanding Balance
$109,715
Interest Rate
5.5%
Mortgage Type
FHA
Estimated Equity
$365,879
Purchase Details
Closed on
Oct 6, 2009
Sold by
Citimortgage
Bought by
Federal Home Loan Mortgage Corporation
Purchase Details
Closed on
Nov 8, 2005
Sold by
Clendenin Richard A
Bought by
Clendenin Richard A and Shelley Mae
Home Financials for this Owner
Home Financials are based on the most recent Mortgage that was taken out on this home.
Original Mortgage
$215,800
Interest Rate
5.84%
Mortgage Type
New Conventional
Create a Home Valuation Report for This Property
The Home Valuation Report is an in-depth analysis detailing your home's value as well as a comparison with similar homes in the area
Home Values in the Area
Average Home Value in this Area
Purchase History
| Date | Buyer | Sale Price | Title Company |
|---|---|---|---|
| Stewart Joseph M | -- | -- | |
| Federal Home Loan Mortgage Corporation | -- | -- | |
| Citimortgage | $172,070 | -- | |
| Clendenin Richard A | -- | -- | |
| Clendenin Richard A | $227,200 | -- |
Source: Public Records
Mortgage History
| Date | Status | Borrower | Loan Amount |
|---|---|---|---|
| Open | Stewart Joseph M | $162,011 | |
| Previous Owner | Clendenin Richard A | $215,800 |
Source: Public Records
Tax History Compared to Growth
Tax History
| Year | Tax Paid | Tax Assessment Tax Assessment Total Assessment is a certain percentage of the fair market value that is determined by local assessors to be the total taxable value of land and additions on the property. | Land | Improvement |
|---|---|---|---|---|
| 2024 | $3,787 | $173,560 | $32,480 | $141,080 |
| 2023 | $3,402 | $169,520 | $32,480 | $137,040 |
| 2022 | $3,543 | $138,560 | $25,000 | $113,560 |
| 2021 | $3,387 | $124,760 | $24,000 | $100,760 |
| 2020 | $3,039 | $104,400 | $17,480 | $86,920 |
| 2019 | $2,909 | $94,680 | $16,200 | $78,480 |
| 2018 | $2,817 | $94,680 | $16,200 | $78,480 |
| 2017 | $3,090 | $89,680 | $16,200 | $73,480 |
| 2016 | $2,716 | $87,400 | $16,200 | $71,200 |
| 2015 | $2,571 | $78,920 | $15,000 | $63,920 |
| 2014 | $2,440 | $70,520 | $0 | $0 |
Source: Public Records
Map
Nearby Homes
- 4983 Guthrie Cemetery Rd
- 0 Emmett Still Rd Unit TRACT 04 20086873
- 468 Copper Ridge Dr
- 1088 Cannon Farm Rd
- 5380 Gum Creek Ct
- 0 Emmett Still-Lot 4 Rd
- 1393 Silver Thorne Ct
- 1006 Silver Thorne Dr
- 1030 Silver Thorne Dr
- 1050 Silver Thorne Dr
- LOT 12 Guthrie Cemetery Rd
- LOT 13 Guthrie Cemetery Rd
- 5206 Guthrie Cemetery Rd
- 4820 Old Highway 138
- 4859 Highway 138
- 431 Greenhill Way
- 421 Greenhill Way
- 2361 Emerald Dr
- 1015 Carriage Way
- 4503 Atha Cir
- 5025 Brookstone Ln
- 5013 Brookstone Ln
- 6001 Cole Ln
- 5016 Brookstone Ln
- 5009 Brookstone Ln
- 5029 Brookstone Ln
- 5024 Brookstone Ln
- 0 Brookstone Ln Unit 7425628
- 0 Brookstone Ln Unit 7027568
- 0 Brookstone Ln Unit 3249456
- 0 Brookstone Ln Unit 8866562
- 0 Brookstone Ln Unit 8018032
- 0 Brookstone Ln Unit 8381015
- 0 Brookstone Ln Unit 7565539
- 0 Brookstone Ln Unit 7620718
- 0 Brookstone Ln Unit 7465649
- 0 Brookstone Ln
- 5028 Brookstone Ln
- 5012 Brookstone Ln
- 6005 Cole Ln