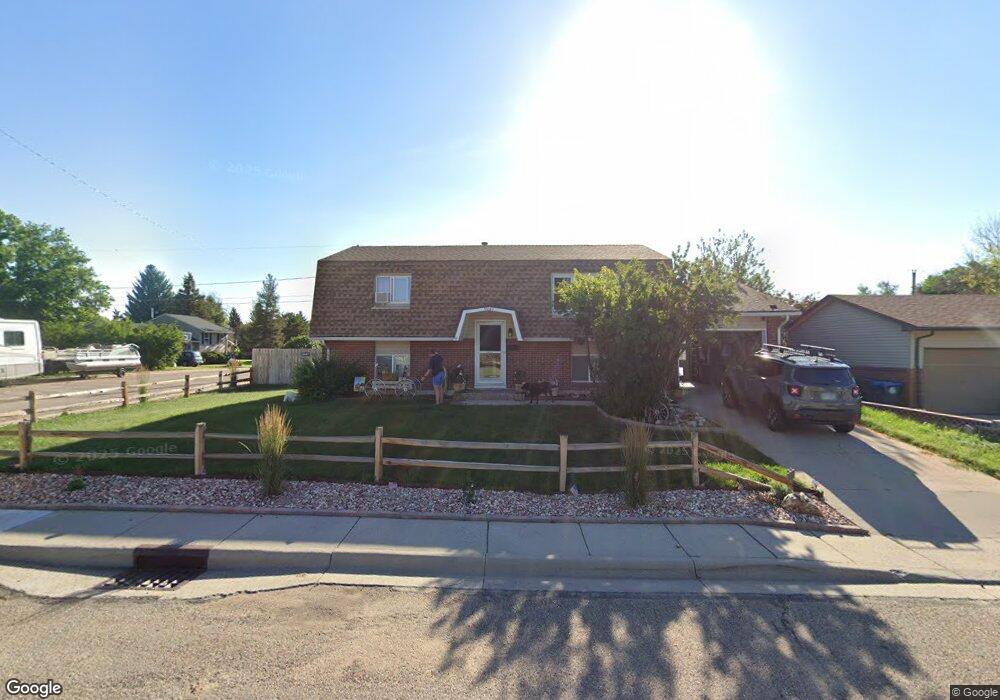
5021 Linden Way Cheyenne, WY 82009
Estimated Value: $296,000 - $352,000
--
Bed
--
Bath
925
Sq Ft
$361/Sq Ft
Est. Value
About This Home
This home is located at 5021 Linden Way, Cheyenne, WY 82009 and is currently estimated at $333,885, approximately $360 per square foot. 5021 Linden Way is a home located in Laramie County with nearby schools including Buffalo Ridge Elementary School, Carey Junior High School, and East High School.
Ownership History
Date
Name
Owned For
Owner Type
Purchase Details
Closed on
Nov 25, 2014
Sold by
Magness Laura and Christopherson Laura L
Bought by
Magness Laura and Magness Robert Williams
Current Estimated Value
Home Financials for this Owner
Home Financials are based on the most recent Mortgage that was taken out on this home.
Original Mortgage
$132,937
Outstanding Balance
$46,026
Interest Rate
3.99%
Mortgage Type
Closed End Mortgage
Estimated Equity
$287,859
Purchase Details
Closed on
Feb 23, 2007
Sold by
U S Bank Na Nd
Bought by
Christopherson Laura L
Home Financials for this Owner
Home Financials are based on the most recent Mortgage that was taken out on this home.
Original Mortgage
$5,775
Interest Rate
6.25%
Mortgage Type
Unknown
Purchase Details
Closed on
May 8, 2006
Sold by
Trujillo Joe Pete and Trujillo Mary F
Bought by
Us Bank Na Nd
Create a Home Valuation Report for This Property
The Home Valuation Report is an in-depth analysis detailing your home's value as well as a comparison with similar homes in the area
Home Values in the Area
Average Home Value in this Area
Purchase History
| Date | Buyer | Sale Price | Title Company |
|---|---|---|---|
| Magness Laura | -- | None Available | |
| Christopherson Laura L | -- | None Available | |
| Us Bank Na Nd | $134,949 | None Available | |
| Us Bank Na Nd | $134,949 | None Available |
Source: Public Records
Mortgage History
| Date | Status | Borrower | Loan Amount |
|---|---|---|---|
| Open | Magness Laura | $132,937 | |
| Closed | Christopherson Laura L | $5,775 | |
| Closed | Christopherson Laura L | $123,068 |
Source: Public Records
Tax History Compared to Growth
Tax History
| Year | Tax Paid | Tax Assessment Tax Assessment Total Assessment is a certain percentage of the fair market value that is determined by local assessors to be the total taxable value of land and additions on the property. | Land | Improvement |
|---|---|---|---|---|
| 2025 | $2,125 | $23,325 | $3,196 | $20,129 |
| 2024 | $2,125 | $30,049 | $4,262 | $25,787 |
| 2023 | $2,105 | $29,776 | $4,262 | $25,514 |
| 2022 | $1,989 | $27,553 | $4,262 | $23,291 |
| 2021 | $1,776 | $24,556 | $4,262 | $20,294 |
| 2020 | $1,609 | $22,304 | $4,262 | $18,042 |
| 2019 | $1,515 | $20,985 | $4,262 | $16,723 |
| 2018 | $1,394 | $19,486 | $3,203 | $16,283 |
| 2017 | $1,327 | $18,389 | $3,203 | $15,186 |
| 2016 | $1,260 | $17,449 | $3,036 | $14,413 |
| 2015 | $1,178 | $16,313 | $3,036 | $13,277 |
| 2014 | $1,160 | $15,956 | $3,036 | $12,920 |
Source: Public Records
Map
Nearby Homes
- 5125 Maple Way
- 4745 Windmill Rd
- 4729 Cactus Way
- 4940 Mountain Rd
- 2507 Pattison Ave Unit 1-4
- 4700 King Arthur Way
- 5402 Hilltop Ave
- 3117 Douglas St
- 100 Clover Ct
- 5502 Canyon Rd
- 3315 Dean Paul Dr
- 5120 Bowie Dr
- 4816 Ridge Rd
- 5208 Danielle Ct
- 2544 Levi Rd
- 2113 Pattison Ave
- 5702 Mica Bluff
- 5801 Mica Bluff
- 3320 Thomas Rd
- 4744 Piccadilly Dr
- 5015 Linden Way
- 5020 Maple Way
- 5014 Maple Way
- 5103 Linden Way
- 5020 Linden Way
- 5009 Linden Way
- 2612 Jackson St
- 5008 Maple Way
- 5008 Linden Way
- 5104 Linden Way
- 5111 Linden Way
- 5003 Linden Way
- 5002 Maple Way
- 5110 Maple Way
- 2525 Jackson Ct
- 5002 Linden Way
- 5021 Maple Way
- 5119 Linden Way
- 5015 Maple Way
- 4777 Linden Way