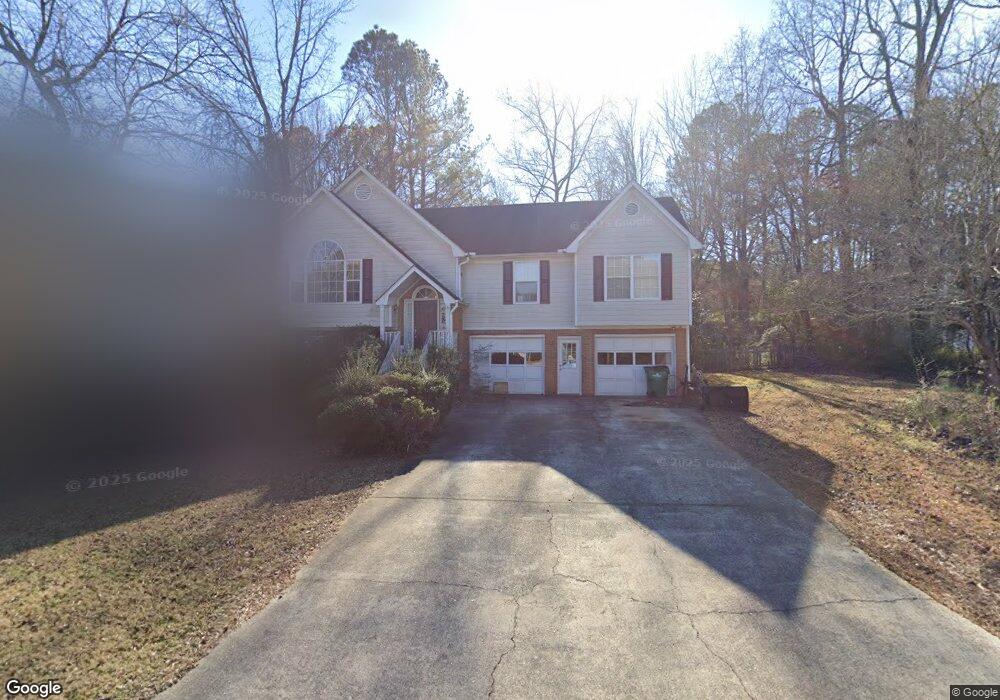
5021 Sunbrook Way NW Acworth, GA 30101
Estimated Value: $386,544 - $418,000
4
Beds
3
Baths
2,395
Sq Ft
$170/Sq Ft
Est. Value
About This Home
This home is located at 5021 Sunbrook Way NW, Acworth, GA 30101 and is currently estimated at $407,136, approximately $169 per square foot. 5021 Sunbrook Way NW is a home located in Cobb County with nearby schools including Frey Elementary School, Durham Middle School, and Allatoona High School.
Ownership History
Date
Name
Owned For
Owner Type
Purchase Details
Closed on
May 22, 2009
Sold by
Evans James D and Evans Erin A
Bought by
Evans James D
Current Estimated Value
Home Financials for this Owner
Home Financials are based on the most recent Mortgage that was taken out on this home.
Original Mortgage
$192,527
Outstanding Balance
$121,118
Interest Rate
4.77%
Mortgage Type
VA
Estimated Equity
$286,018
Purchase Details
Closed on
Jul 25, 2008
Sold by
Rdo Ents Llc
Bought by
Evans James D
Home Financials for this Owner
Home Financials are based on the most recent Mortgage that was taken out on this home.
Original Mortgage
$186,198
Interest Rate
6.37%
Mortgage Type
VA
Purchase Details
Closed on
Dec 4, 2007
Sold by
London Rufus M Chong Y
Bought by
Rdo Ents Llc
Purchase Details
Closed on
Mar 19, 1993
Sold by
Westside Bldrs Inc
Bought by
Koffarnus Mark L
Home Financials for this Owner
Home Financials are based on the most recent Mortgage that was taken out on this home.
Original Mortgage
$104,596
Interest Rate
7.8%
Mortgage Type
FHA
Create a Home Valuation Report for This Property
The Home Valuation Report is an in-depth analysis detailing your home's value as well as a comparison with similar homes in the area
Home Values in the Area
Average Home Value in this Area
Purchase History
| Date | Buyer | Sale Price | Title Company |
|---|---|---|---|
| Evans James D | -- | -- | |
| Evans James D | $180,300 | -- | |
| Rdo Ents Llc | $138,100 | -- | |
| Koffarnus Mark L | $106,900 | -- |
Source: Public Records
Mortgage History
| Date | Status | Borrower | Loan Amount |
|---|---|---|---|
| Open | Evans James D | $192,527 | |
| Previous Owner | Evans James D | $186,198 | |
| Previous Owner | Koffarnus Mark L | $104,596 |
Source: Public Records
Tax History Compared to Growth
Tax History
| Year | Tax Paid | Tax Assessment Tax Assessment Total Assessment is a certain percentage of the fair market value that is determined by local assessors to be the total taxable value of land and additions on the property. | Land | Improvement |
|---|---|---|---|---|
| 2024 | $3,621 | $148,620 | $36,000 | $112,620 |
| 2023 | $2,772 | $134,480 | $34,000 | $100,480 |
| 2022 | $2,782 | $109,024 | $22,000 | $87,024 |
| 2021 | $2,488 | $95,572 | $22,000 | $73,572 |
| 2020 | $2,488 | $95,572 | $22,000 | $73,572 |
| 2019 | $2,175 | $81,260 | $22,000 | $59,260 |
| 2018 | $2,175 | $81,260 | $22,000 | $59,260 |
| 2017 | $1,582 | $63,936 | $12,000 | $51,936 |
| 2016 | $1,583 | $63,936 | $12,000 | $51,936 |
| 2015 | $1,099 | $46,148 | $14,000 | $32,148 |
| 2014 | $1,109 | $46,148 | $0 | $0 |
Source: Public Records
Map
Nearby Homes
- 5046 Sunbrook Dr NW
- 0 Mars Hill Rd Unit 7657672
- 2275 Catalonia Ln NW
- 2316 Fripp Overlook NW
- 2295 Inverwood Dr NW
- 5153 Elkins Ln NW
- 4544 Cavallon Way NW
- 5087 Dillingham Dr NW
- 4790 Galloways Farm Ln NW
- 5105 Dillingham Dr NW
- 4902 Pleasantry Way NW
- 4525 Cavallon Way NW
- 4980 Pleasantry Way NW
- 4467 Sterling Pointe Dr NW
- 4980 Newpark Ln NW Unit 2
- 5116 Barton Pass NW
- 4973 Newpark Ln NW
- 5019 Sunbrook Way NW
- 5023 Sunbrook Way NW
- 5042 Sunbrook Dr NW
- 5032 Sunbrook Way NW
- 5044 Sunbrook Dr NW
- 5030 Sunbrook Way NW
- 5025 Sunbrook Way NW
- 5026 Sunbrook Way NW
- 5036 Sunbrook Way NW
- 5034 Sunbrook Way NW
- 5028 Sunbrook Way NW
- 5024 Sunbrook Way NW
- 5043 Sunbrook Dr NW
- 5017 Sunbrook Way NW
- 5045 Sunbrook Dr NW
- 5022 Sunbrook Way NW
- 5047 Sunbrook Dr NW
- 2484 Mars Hill Rd NW
- 5015 Sunbrook Way NW
- 2254 Sunbrook Ct NW