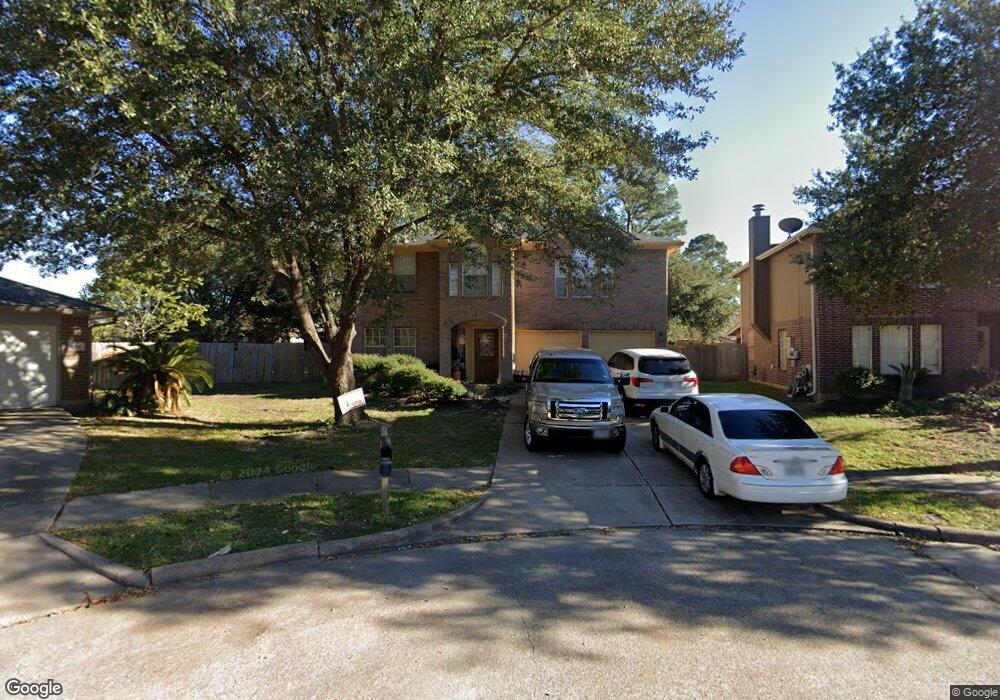
5022 Tealgate Dr Spring, TX 77373
Estimated Value: $282,000 - $295,000
5
Beds
3
Baths
2,741
Sq Ft
$106/Sq Ft
Est. Value
About This Home
This home is located at 5022 Tealgate Dr, Spring, TX 77373 and is currently estimated at $289,818, approximately $105 per square foot. 5022 Tealgate Dr is a home located in Harris County with nearby schools including Chet Burchett Elementary School, Ricky C. Bailey Middle School, and Spring High School.
Ownership History
Date
Name
Owned For
Owner Type
Purchase Details
Closed on
Aug 15, 2001
Sold by
Garmon Michael N
Bought by
Torres Armando
Current Estimated Value
Home Financials for this Owner
Home Financials are based on the most recent Mortgage that was taken out on this home.
Original Mortgage
$100,000
Outstanding Balance
$38,980
Interest Rate
7.14%
Estimated Equity
$250,838
Purchase Details
Closed on
Dec 14, 1999
Sold by
Garmon Kelley Sue
Bought by
Garmon Michael Neal
Home Financials for this Owner
Home Financials are based on the most recent Mortgage that was taken out on this home.
Original Mortgage
$108,500
Interest Rate
7.86%
Purchase Details
Closed on
Nov 13, 1997
Sold by
Mhi Partnership Ltd
Bought by
Garmon Michael N and Garmon Kelly S
Home Financials for this Owner
Home Financials are based on the most recent Mortgage that was taken out on this home.
Original Mortgage
$100,700
Interest Rate
7.23%
Purchase Details
Closed on
Feb 6, 1997
Sold by
Mhi Birnam Ltd
Bought by
Mhi Partnership Ltd
Create a Home Valuation Report for This Property
The Home Valuation Report is an in-depth analysis detailing your home's value as well as a comparison with similar homes in the area
Home Values in the Area
Average Home Value in this Area
Purchase History
| Date | Buyer | Sale Price | Title Company |
|---|---|---|---|
| Torres Armando | -- | Stewart Title | |
| Garmon Michael Neal | -- | American Title Co | |
| Garmon Michael N | -- | Mhi Title | |
| Mhi Partnership Ltd | -- | Stewart Title |
Source: Public Records
Mortgage History
| Date | Status | Borrower | Loan Amount |
|---|---|---|---|
| Open | Torres Armando | $100,000 | |
| Previous Owner | Garmon Michael Neal | $108,500 | |
| Previous Owner | Garmon Michael N | $100,700 |
Source: Public Records
Tax History
| Year | Tax Paid | Tax Assessment Tax Assessment Total Assessment is a certain percentage of the fair market value that is determined by local assessors to be the total taxable value of land and additions on the property. | Land | Improvement |
|---|---|---|---|---|
| 2025 | $2,753 | $311,508 | $40,726 | $270,782 |
| 2024 | $2,753 | $315,377 | $40,726 | $274,651 |
| 2023 | $2,753 | $346,421 | $40,726 | $305,695 |
| 2022 | $6,094 | $290,643 | $16,290 | $274,353 |
| 2021 | $5,869 | $226,906 | $16,290 | $210,616 |
| 2020 | $5,697 | $212,681 | $16,290 | $196,391 |
| 2019 | $5,368 | $192,507 | $16,290 | $176,217 |
| 2018 | $4,353 | $169,149 | $16,290 | $152,859 |
| 2017 | $4,654 | $169,149 | $16,290 | $152,859 |
| 2016 | $4,231 | $169,149 | $16,290 | $152,859 |
| 2015 | $3,166 | $152,462 | $16,290 | $136,172 |
| 2014 | $3,166 | $129,867 | $16,290 | $113,577 |
Source: Public Records
Map
Nearby Homes
- 23914 Goodfellow Dr
- 4919 Tealgate Dr
- 4919 Hickorygate Dr
- 4911 Tealgate Dr
- 4827 Tealgate Dr
- 24039 Clipper Hill Ln
- 5026 Forest Hurst Dr
- 4815 Hickorygate Dr
- 23663 Rainbow Eucalyptus Dr
- 4831 Blue Jacaranda Way
- 23915 Floragate Dr
- 24039 Kentwood Springs Dr
- 5110 Forest Terrace Dr
- 23639 Buttress Root Dr
- 23622 Goodfellow Dr
- 24046 Kentwood Springs Dr
- 23607 Mesquite Trail Ln
- 23815 Firegate Dr
- 23815 Hilltop Canyon Ln
- 6067 Diamond Vista Ct
- 5026 Tealgate Dr
- 5018 Tealgate Dr
- 0 Quailgate Dr
- 5023 Quailgate Dr
- 5027 Quailgate Dr
- 5019 Quailgate Dr
- 5031 Quailgate Dr
- 5014 Tealgate Dr
- 23831 Goodfellow Dr
- 23835 Goodfellow Dr
- 5027 Tealgate Dr
- 5015 Quailgate Dr
- 23903 Goodfellow Dr
- 5035 Quailgate Dr
- 5010 Tealgate Dr
- 5023 Tealgate Dr
- 5019 Tealgate Dr
- 5011 Quailgate Dr
- 23907 Goodfellow Dr
- 5015 Tealgate Dr
Your Personal Tour Guide
Ask me questions while you tour the home.