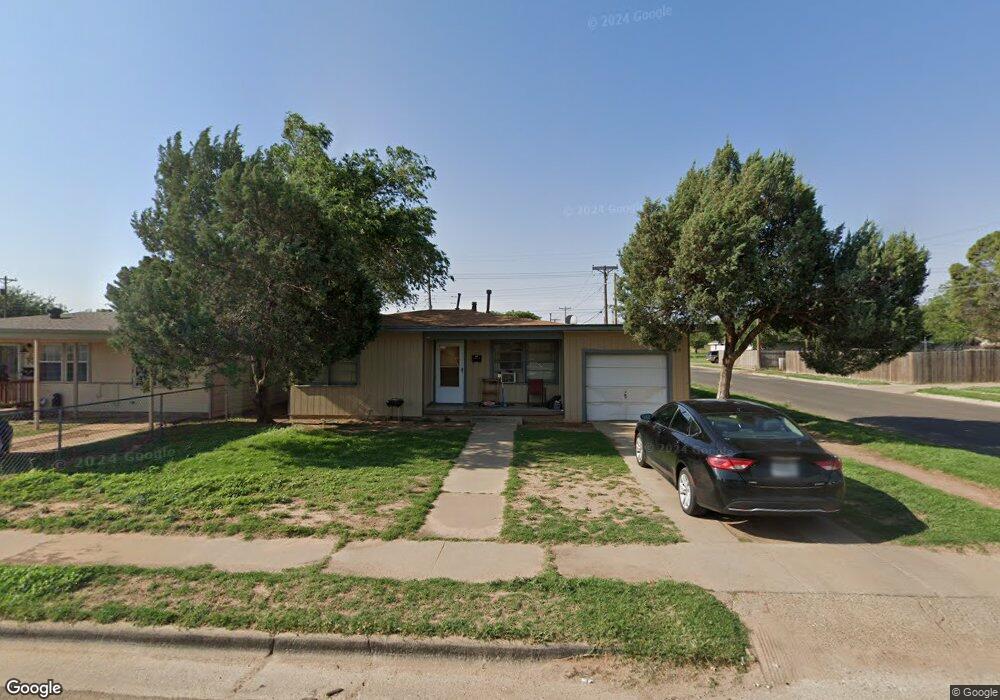
5023 35th St Lubbock, TX 79414
Stubbs-Stewart NeighborhoodEstimated Value: $77,000 - $100,000
2
Beds
1
Bath
752
Sq Ft
$115/Sq Ft
Est. Value
About This Home
This home is located at 5023 35th St, Lubbock, TX 79414 and is currently estimated at $86,705, approximately $115 per square foot. 5023 35th St is a home located in Lubbock County with nearby schools including Stewart Elementary School, Commander William C. McCool Academy, and Irons Middle School.
Ownership History
Date
Name
Owned For
Owner Type
Purchase Details
Closed on
Jan 30, 2025
Sold by
Arches National Holdings Llc
Bought by
Gvr Homes Llc
Current Estimated Value
Purchase Details
Closed on
Oct 7, 1992
Sold by
Martin Eric Oker 1976 Trust
Bought by
Martin Eric Oker 1976 Trust
Purchase Details
Closed on
Jun 29, 1988
Sold by
Martin Eric
Bought by
Martin Eric Oker 1976 Trust
Purchase Details
Closed on
Sep 2, 1986
Sold by
Martin Eric Oker 1976 Trust
Bought by
Martin Eric Oker 1976 Trust
Create a Home Valuation Report for This Property
The Home Valuation Report is an in-depth analysis detailing your home's value as well as a comparison with similar homes in the area
Home Values in the Area
Average Home Value in this Area
Purchase History
| Date | Buyer | Sale Price | Title Company |
|---|---|---|---|
| Gvr Homes Llc | -- | Service Title | |
| Martin Eric Oker 1976 Trust | -- | -- | |
| Martin Eric Oker 1976 Trust | -- | -- | |
| Martin Eric Oker 1976 Trust | -- | -- |
Source: Public Records
Tax History Compared to Growth
Tax History
| Year | Tax Paid | Tax Assessment Tax Assessment Total Assessment is a certain percentage of the fair market value that is determined by local assessors to be the total taxable value of land and additions on the property. | Land | Improvement |
|---|---|---|---|---|
| 2025 | $1,331 | $72,731 | $23,000 | $49,731 |
| 2024 | $1,331 | $73,302 | $9,000 | $64,302 |
| 2023 | $1,315 | $70,768 | $9,000 | $61,768 |
| 2022 | $1,471 | $72,668 | $9,000 | $63,668 |
| 2021 | $1,001 | $46,723 | $9,000 | $37,723 |
| 2020 | $1,120 | $51,501 | $9,000 | $42,501 |
| 2019 | $1,176 | $52,374 | $9,000 | $43,374 |
| 2018 | $1,257 | $55,911 | $9,000 | $46,911 |
| 2017 | $1,102 | $48,948 | $9,000 | $39,948 |
| 2016 | $1,100 | $48,881 | $7,100 | $41,781 |
| 2015 | $1,024 | $42,577 | $7,100 | $35,477 |
| 2014 | $1,024 | $46,057 | $3,250 | $42,807 |
Source: Public Records
Map
Nearby Homes