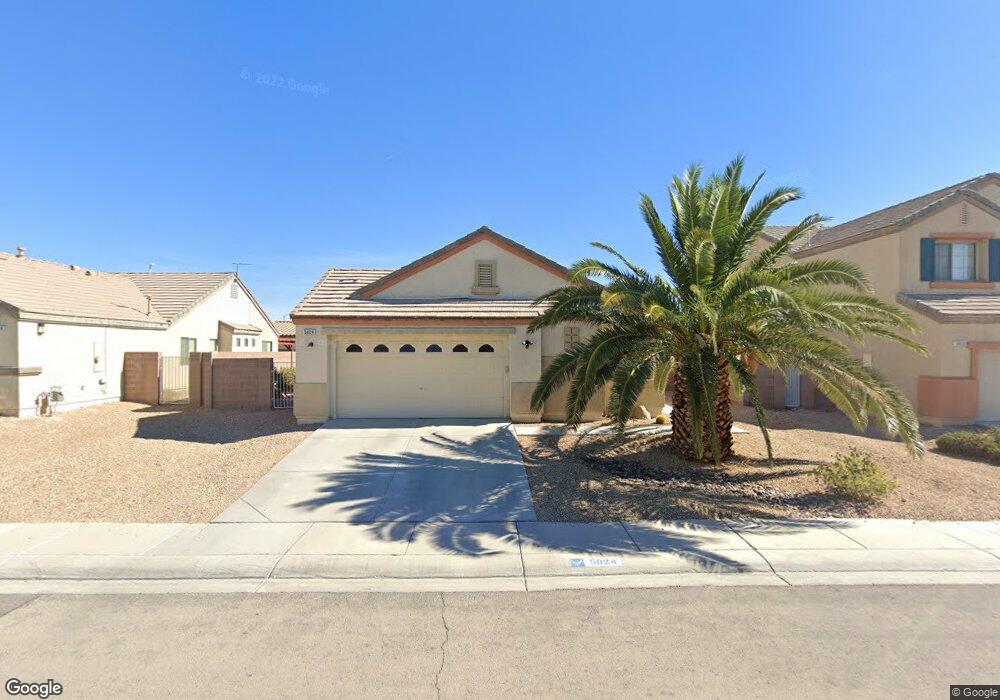
5024 Crying Heart St North Las Vegas, NV 89031
Craig Ranch NeighborhoodEstimated Value: $398,409 - $418,000
3
Beds
2
Baths
1,535
Sq Ft
$265/Sq Ft
Est. Value
About This Home
This home is located at 5024 Crying Heart St, North Las Vegas, NV 89031 and is currently estimated at $406,352, approximately $264 per square foot. 5024 Crying Heart St is a home located in Clark County with nearby schools including Raul P. Elizondo Elementary School, Clifford O. Findlay Middle School, and Mojave High School.
Ownership History
Date
Name
Owned For
Owner Type
Purchase Details
Closed on
Feb 16, 2022
Sold by
Reed Jason W
Bought by
Sarabia Joseph A and Valdez Daisy Ra
Current Estimated Value
Home Financials for this Owner
Home Financials are based on the most recent Mortgage that was taken out on this home.
Original Mortgage
$386,694
Outstanding Balance
$359,075
Interest Rate
3.55%
Mortgage Type
VA
Estimated Equity
$47,277
Purchase Details
Closed on
May 10, 2017
Sold by
Villlobos Chantele
Bought by
Reed Jason W
Home Financials for this Owner
Home Financials are based on the most recent Mortgage that was taken out on this home.
Original Mortgage
$209,407
Interest Rate
4.14%
Mortgage Type
VA
Purchase Details
Closed on
Feb 14, 2005
Sold by
Centex Homes
Bought by
Holencsak William and Holencsak Roseanne
Home Financials for this Owner
Home Financials are based on the most recent Mortgage that was taken out on this home.
Original Mortgage
$100,750
Interest Rate
5.79%
Mortgage Type
Unknown
Create a Home Valuation Report for This Property
The Home Valuation Report is an in-depth analysis detailing your home's value as well as a comparison with similar homes in the area
Home Values in the Area
Average Home Value in this Area
Purchase History
| Date | Buyer | Sale Price | Title Company |
|---|---|---|---|
| Sarabia Joseph A | $388,000 | Ticor Title | |
| Reed Jason W | -- | Ticor Title | |
| Reed Jason W | -- | North American Title Co | |
| Reed Jason W | $205,000 | None Available | |
| Holencsak William | $275,769 | Commerce Title |
Source: Public Records
Mortgage History
| Date | Status | Borrower | Loan Amount |
|---|---|---|---|
| Open | Sarabia Joseph A | $386,694 | |
| Previous Owner | Reed Jason W | $209,407 | |
| Previous Owner | Holencsak William | $100,750 |
Source: Public Records
Tax History Compared to Growth
Tax History
| Year | Tax Paid | Tax Assessment Tax Assessment Total Assessment is a certain percentage of the fair market value that is determined by local assessors to be the total taxable value of land and additions on the property. | Land | Improvement |
|---|---|---|---|---|
| 2025 | $1,610 | $107,940 | $33,950 | $73,990 |
| 2024 | $1,491 | $107,940 | $33,950 | $73,990 |
| 2023 | $1,491 | $99,732 | $30,100 | $69,632 |
| 2022 | $1,381 | $90,862 | $27,300 | $63,562 |
| 2021 | $1,279 | $86,193 | $25,900 | $60,293 |
| 2020 | $1,239 | $82,069 | $22,400 | $59,669 |
| 2019 | $1,203 | $76,972 | $18,200 | $58,772 |
| 2018 | $1,167 | $66,441 | $15,050 | $51,391 |
| 2017 | $1,975 | $58,864 | $12,600 | $46,264 |
| 2016 | $1,107 | $50,839 | $10,500 | $40,339 |
| 2015 | $1,103 | $40,670 | $5,950 | $34,720 |
| 2014 | $1,071 | $33,363 | $5,950 | $27,413 |
Source: Public Records
Map
Nearby Homes
- 4925 Goldfield St
- 5136 Stonecrop St
- 113 Chino Ave
- 13 Deseo Ct
- 17 Deseo Ct
- 5036 Eagle Way
- 5044 Eagle Way
- 5048 Eagle Way
- 5052 Eagle Way
- 5128 Eagle Way
- 5140 Eagle Way
- 5160 Eagle Way
- 5228 Daywood St
- 5029 Corbindale St
- 5025 Corbindale St
- 5021 Corbindale St
- 5017 Corbindale St
- 4909 Finca St
- Residence 2119 Plan at Bravado
- Residence 1943 Plan at Bravado
- 5020 Crying Heart St
- 29 Blue Sunrise Ave
- 5016 Crying Heart St
- 5032 Crying Heart St
- 112 Tainted Berry Ave
- 25 Blue Sunrise Ave
- 113 Melon Aroma Ave Unit 2
- 5033 Ruby Sunset St
- 5012 Crying Heart St
- 21 Blue Sunrise Ave
- 116 Tainted Berry Ave Unit 2
- 117 Melon Aroma Ave
- 5036 Crying Heart St
- 5037 Ruby Sunset St
- 113 Tainted Berry Ave
- 5045 Goldfield St
- 5008 Crying Heart St Unit 2
- 112 Melon Aroma Ave
- 112 Melon Aroma Ave Unit sfr
- 120 Tainted Berry Ave