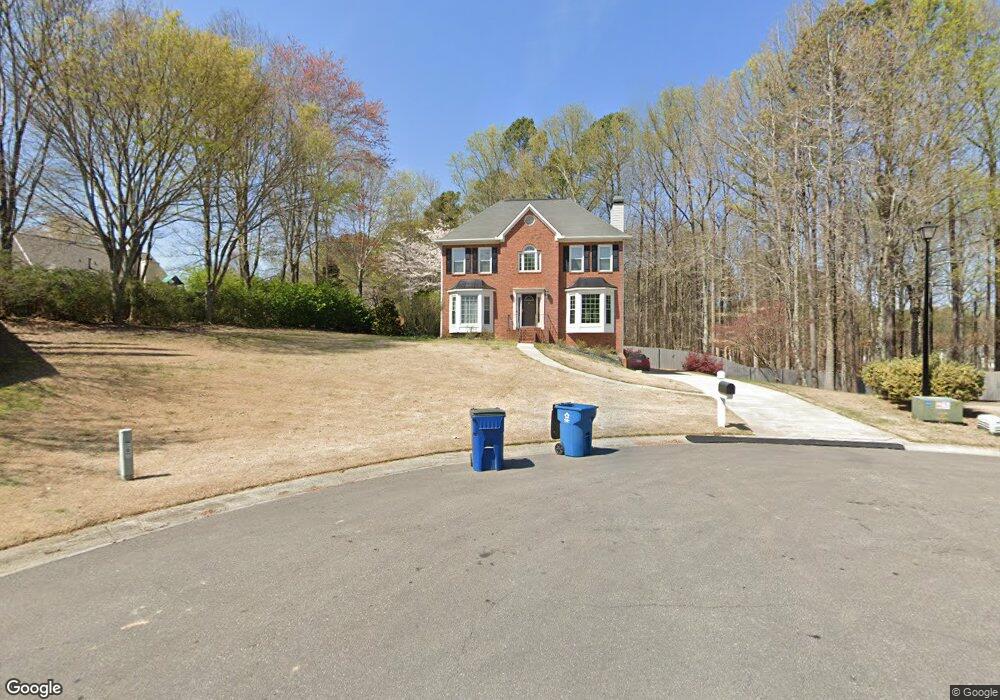
5025 Highgate Ct Cumming, GA 30040
Estimated Value: $503,857 - $524,000
3
Beds
3
Baths
2,062
Sq Ft
$249/Sq Ft
Est. Value
About This Home
This home is located at 5025 Highgate Ct, Cumming, GA 30040 and is currently estimated at $513,214, approximately $248 per square foot. 5025 Highgate Ct is a home located in Forsyth County with nearby schools including Sawnee Elementary School, West Forsyth High School, and Montessori School of Cumming.
Ownership History
Date
Name
Owned For
Owner Type
Purchase Details
Closed on
Oct 31, 2001
Sold by
Lackey David M and Lackey Geri M
Bought by
Donaldson Paul D and Donaldson Rebecca J
Current Estimated Value
Home Financials for this Owner
Home Financials are based on the most recent Mortgage that was taken out on this home.
Original Mortgage
$164,000
Outstanding Balance
$64,194
Interest Rate
6.74%
Mortgage Type
New Conventional
Estimated Equity
$449,020
Purchase Details
Closed on
Oct 1, 1999
Sold by
Hinson Laura B
Bought by
Miller Jeffrey A and Miller Catherine A
Home Financials for this Owner
Home Financials are based on the most recent Mortgage that was taken out on this home.
Original Mortgage
$139,900
Interest Rate
7.79%
Mortgage Type
New Conventional
Purchase Details
Closed on
May 31, 1996
Sold by
Walls Prop Inc
Bought by
Brieva Paul Laura
Create a Home Valuation Report for This Property
The Home Valuation Report is an in-depth analysis detailing your home's value as well as a comparison with similar homes in the area
Home Values in the Area
Average Home Value in this Area
Purchase History
| Date | Buyer | Sale Price | Title Company |
|---|---|---|---|
| Donaldson Paul D | $415,500 | -- | |
| Miller Jeffrey A | $174,900 | -- | |
| Brieva Paul Laura | $151,300 | -- |
Source: Public Records
Mortgage History
| Date | Status | Borrower | Loan Amount |
|---|---|---|---|
| Open | Donaldson Paul D | $164,000 | |
| Previous Owner | Miller Jeffrey A | $139,900 | |
| Closed | Brieva Paul Laura | $0 |
Source: Public Records
Tax History Compared to Growth
Tax History
| Year | Tax Paid | Tax Assessment Tax Assessment Total Assessment is a certain percentage of the fair market value that is determined by local assessors to be the total taxable value of land and additions on the property. | Land | Improvement |
|---|---|---|---|---|
| 2025 | $929 | $201,320 | $56,000 | $145,320 |
| 2024 | $929 | $180,000 | $52,000 | $128,000 |
| 2023 | $823 | $176,152 | $52,000 | $124,152 |
| 2022 | $912 | $120,568 | $32,000 | $88,568 |
| 2021 | $3,329 | $120,568 | $32,000 | $88,568 |
| 2020 | $3,195 | $115,712 | $32,000 | $83,712 |
| 2019 | $2,882 | $104,212 | $26,000 | $78,212 |
| 2018 | $2,754 | $99,596 | $26,000 | $73,596 |
| 2017 | $2,625 | $94,592 | $26,000 | $68,592 |
| 2016 | $2,337 | $84,192 | $20,000 | $64,192 |
| 2015 | $2,341 | $84,192 | $20,000 | $64,192 |
| 2014 | $1,857 | $70,136 | $0 | $0 |
Source: Public Records
Map
Nearby Homes
- 4605 Vanadium Bend
- 4605 Ansley Ln
- 4435 Manor Creek Dr
- 5525 Tallantworth Trail
- 4430 Cadmium Dr
- 5325 Southern Oak Ct
- 5370 Hyde Dr
- 5330 Hyde Dr
- Woodward Plan at Arden
- Riverton Plan at Arden
- Continental Plan at Arden
- 4685 Columbia St
- 4720 Amelia Ave
- 5125 Hyde Trail
- 5465 Tallantworth Crossing
- 5335 Austrian Pine Ct
- 5430 Hyde Rd
- 4940 Hyde Way
- 4025 Toulon Ln
- 5020 Highgate Ct
- 5070 Ansley Ln
- 0 Highgate Ct Unit 7429174
- 5080 Ansley Ln Unit 114
- 5080 Ansley Ln
- 5020 Ansley Ln
- 5040 Ansley Ln
- 4960 Ansley Ln
- 4910 Rosewood Lake Dr
- 5075 Ansley Ln
- 4920 Rosewood Lake Dr
- 5015 Ansley Ln
- 5065 Ansley Ln
- 5090 Ansley Ln
- 5085 Ansley Ln
- 5035 Ansley Ln
- 5025 Ansley Ln
- 5055 Ansley Ln
- 5005 Ansley Ln
- 4950 Ansley Ln