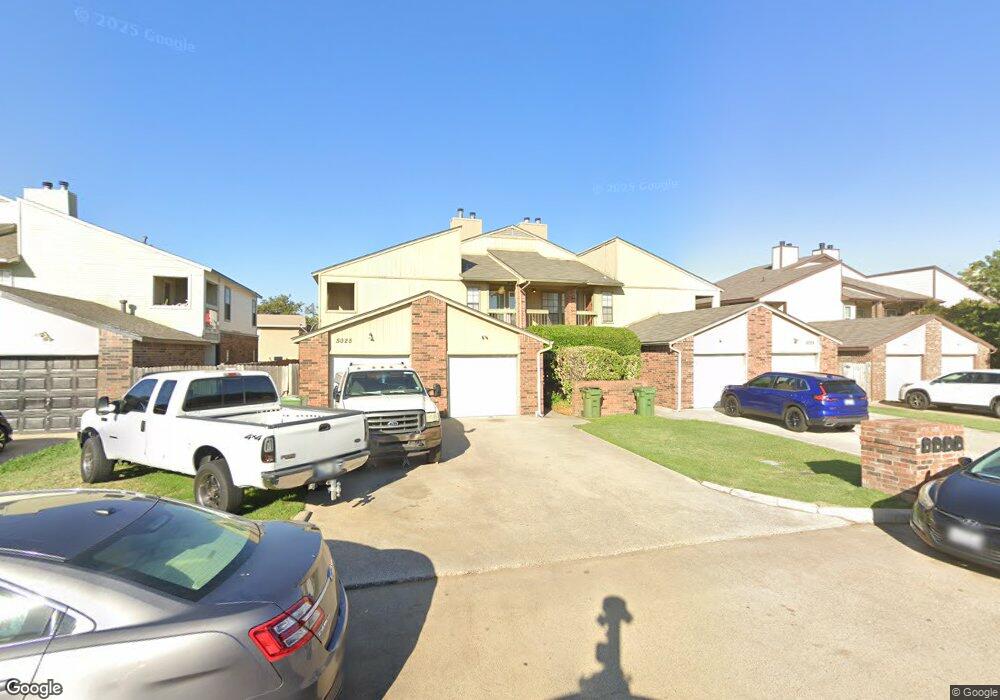
5025 Winder Ct Unit C North Richland Hills, TX 76180
Estimated Value: $587,000 - $777,000
3
Beds
2
Baths
1,163
Sq Ft
$591/Sq Ft
Est. Value
About This Home
This home is located at 5025 Winder Ct Unit C, North Richland Hills, TX 76180 and is currently estimated at $687,388, approximately $591 per square foot. 5025 Winder Ct Unit C is a home located in Tarrant County with nearby schools including Holiday Heights Elementary School, North Richland Middle School, and Richland High School.
Ownership History
Date
Name
Owned For
Owner Type
Purchase Details
Closed on
Dec 21, 2016
Sold by
Le Joseph T
Bought by
Tseng Yutun
Current Estimated Value
Home Financials for this Owner
Home Financials are based on the most recent Mortgage that was taken out on this home.
Original Mortgage
$152,000
Outstanding Balance
$74,724
Interest Rate
4.08%
Mortgage Type
New Conventional
Estimated Equity
$612,664
Purchase Details
Closed on
Jul 1, 2015
Sold by
Le Theresa H and Le Joseph T
Bought by
Le Joseph T
Purchase Details
Closed on
Nov 25, 2013
Sold by
Jolsen Timothy K
Bought by
Le Theresa H and Le Joseph T
Purchase Details
Closed on
Aug 21, 2006
Sold by
Joslen Rentals Llc
Bought by
Joslen Timothy K
Purchase Details
Closed on
May 25, 2006
Sold by
Caycedo Claudio H
Bought by
Joslen Rentals Llc
Create a Home Valuation Report for This Property
The Home Valuation Report is an in-depth analysis detailing your home's value as well as a comparison with similar homes in the area
Home Values in the Area
Average Home Value in this Area
Purchase History
| Date | Buyer | Sale Price | Title Company |
|---|---|---|---|
| Tseng Yutun | -- | None Available | |
| Le Joseph T | -- | None Available | |
| Le Theresa H | -- | None Available | |
| Joslen Timothy K | -- | Commerce Title Co Lakeworth | |
| Joslen Rentals Llc | -- | Commerce Title |
Source: Public Records
Mortgage History
| Date | Status | Borrower | Loan Amount |
|---|---|---|---|
| Open | Tseng Yutun | $152,000 |
Source: Public Records
Tax History Compared to Growth
Tax History
| Year | Tax Paid | Tax Assessment Tax Assessment Total Assessment is a certain percentage of the fair market value that is determined by local assessors to be the total taxable value of land and additions on the property. | Land | Improvement |
|---|---|---|---|---|
| 2025 | $15,687 | $605,395 | $30,000 | $575,395 |
| 2024 | $15,687 | $722,930 | $30,000 | $692,930 |
| 2023 | $14,566 | $664,000 | $30,000 | $634,000 |
| 2022 | $14,898 | $619,108 | $30,000 | $589,108 |
| 2021 | $11,746 | $461,597 | $30,000 | $431,597 |
| 2020 | $13,280 | $521,905 | $20,000 | $501,905 |
| 2019 | $10,972 | $416,666 | $20,000 | $396,666 |
| 2018 | $7,457 | $283,162 | $20,000 | $263,162 |
| 2017 | $7,547 | $280,500 | $20,000 | $260,500 |
| 2016 | $8,518 | $316,596 | $20,000 | $296,596 |
| 2015 | $8,059 | $300,000 | $16,000 | $284,000 |
| 2014 | $8,059 | $300,000 | $16,000 | $284,000 |
Source: Public Records
Map
Nearby Homes
- 5016 Winder Ct
- 5024 Maryanna Way
- 5117 Maryanna Way
- 4916 Susan Lee Ln
- 7409 Jade Cir
- 7717 Janetta Dr
- 7304 Winnell Way
- 7501 Lola Dr
- 7521 Susan Ct
- 7529 Susan Ct
- 7125 Corona Dr
- 4716 Blaney Ave
- 4712 Blaney Ave
- 4540 Ward St
- 4529 Ward St
- 5336 Davis Blvd
- Dalton II Plan at City Point
- Zoe Plan at City Point
- Hampton Plan at City Point
- Conrad Plan at City Point
- 5025 Winder Ct
- 5025 Winder Ct Unit B
- 5025 Winder Ct Unit D
- 5025 Winder Ct Unit A
- 5029 Winder Ct
- 5029 Winder Ct Unit D
- 5029 Winder Ct Unit A
- 5029 Winder Ct Unit C
- 5029 Winder Ct Unit B
- 5021 Winder Ct
- 5021 Winder Ct
- 5021 Winder Ct Unit D
- 5021 Winder Ct Unit A
- 5021 Winder Ct Unit C
- 5017 Winder Ct
- 5017 Winder Ct Unit A
- 5017 Winder Ct Unit C
- 5017 Winder Ct Unit B
- 5024 Winder Ct
- 5024 Winder Ct Unit D