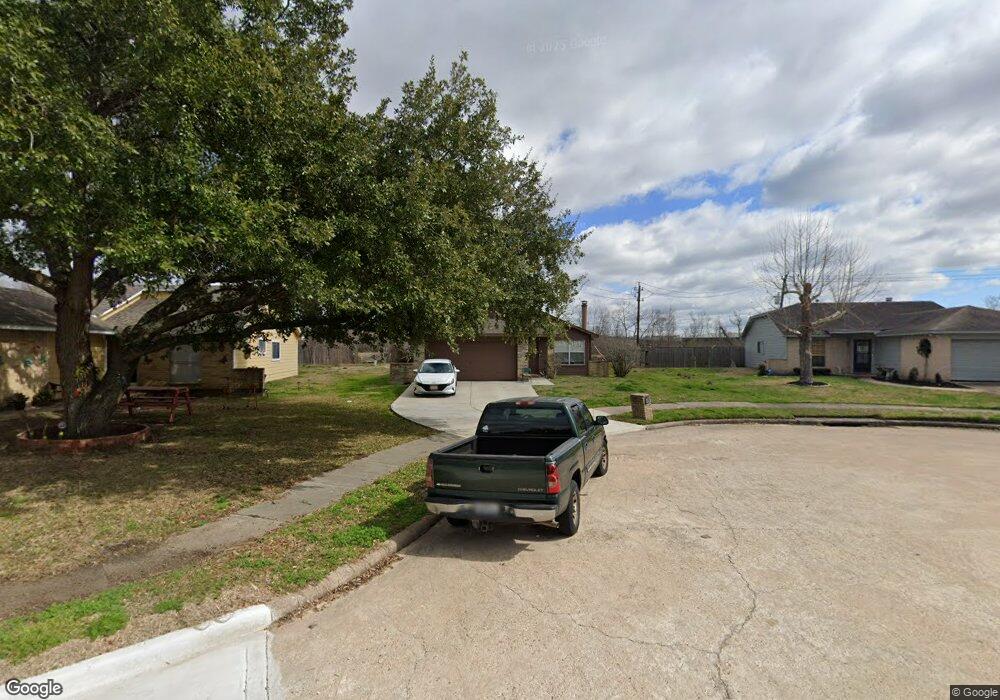
5026 Riverwood Dr Richmond, TX 77469
Estimated Value: $181,264 - $200,000
3
Beds
1
Bath
1,059
Sq Ft
$180/Sq Ft
Est. Value
About This Home
This home is located at 5026 Riverwood Dr, Richmond, TX 77469 and is currently estimated at $190,566, approximately $179 per square foot. 5026 Riverwood Dr is a home located in Fort Bend County with nearby schools including J J Wessendorff Middle School, Lamar Junior High School, and Lamar Consolidated High School.
Ownership History
Date
Name
Owned For
Owner Type
Purchase Details
Closed on
May 8, 2012
Sold by
Mclean Pauline
Bought by
Mclean Pauline and Nathan Faniel
Current Estimated Value
Purchase Details
Closed on
Nov 8, 2005
Sold by
Faniel Nathan
Bought by
Mclean Pauline
Create a Home Valuation Report for This Property
The Home Valuation Report is an in-depth analysis detailing your home's value as well as a comparison with similar homes in the area
Home Values in the Area
Average Home Value in this Area
Purchase History
| Date | Buyer | Sale Price | Title Company |
|---|---|---|---|
| Mclean Pauline | -- | -- | |
| Faniel Nathan | -- | None Available | |
| Mclean Pauline | -- | None Available |
Source: Public Records
Tax History Compared to Growth
Tax History
| Year | Tax Paid | Tax Assessment Tax Assessment Total Assessment is a certain percentage of the fair market value that is determined by local assessors to be the total taxable value of land and additions on the property. | Land | Improvement |
|---|---|---|---|---|
| 2025 | $3,188 | $147,641 | $39,468 | $108,173 |
| 2024 | $3,188 | $146,088 | $39,468 | $106,620 |
| 2023 | $2,739 | $119,724 | $30,360 | $89,364 |
| 2022 | $3,079 | $127,580 | $30,360 | $97,220 |
| 2021 | $3,014 | $120,830 | $30,360 | $90,470 |
| 2020 | $2,403 | $89,940 | $20,240 | $69,700 |
| 2019 | $2,575 | $84,300 | $20,240 | $64,060 |
| 2018 | $2,354 | $75,700 | $20,240 | $55,460 |
| 2017 | $2,055 | $65,560 | $12,140 | $53,420 |
| 2016 | $1,964 | $62,680 | $12,140 | $50,540 |
| 2015 | $986 | $52,550 | $12,140 | $40,410 |
| 2014 | $931 | $49,400 | $12,140 | $37,260 |
Source: Public Records
Map
Nearby Homes
- 5002 Quebec Blvd
- 5027 Quebec Blvd
- 5303 Rivers Edge Dr
- 5319 Rivers Edge Dr
- 4602 Avenue H
- 1109 Frances Dr
- 1809 Hawthorn Dr
- 1806 Cedar Dr
- 1805 Hawthorn Dr
- 221 Rochelle St
- 1205 Preston St
- 0 Collins Rd Unit 57997814
- 3724 Avenue F
- 1504 Radio Ln
- 6219 Deep Gulch Dr
- 6215 Deep Gulch Dr
- 6218 Deep Gulch Dr
- 512 and 514 Travis St
- 3710 Avenue F
- 1716 Maiden Ln
- 5022 Riverwood Dr
- 5030 Riverwood Dr
- 5018 Riverwood Dr
- 5102 Riverwood Dr
- 3427 Brazos Falls Dr
- 3439 Brazos Falls Dr
- 4511 Riverbank Rd
- 4514 Brazos Bank Cir
- 4519 Riverbank Rd
- 4510 Brazos Bank Cir
- 4503 Riverbank Rd
- 4539 Riverbank Rd
- 4426 River Rd
- 3415 Brazos Falls Dr
- 3411 Brazos Falls Dr
- 4511 Brazos Bank Cir
- 5014 Riverwood Dr
- 5023 Riverwood Dr
- 5106 Riverwood Dr
- 5019 Riverwood Dr