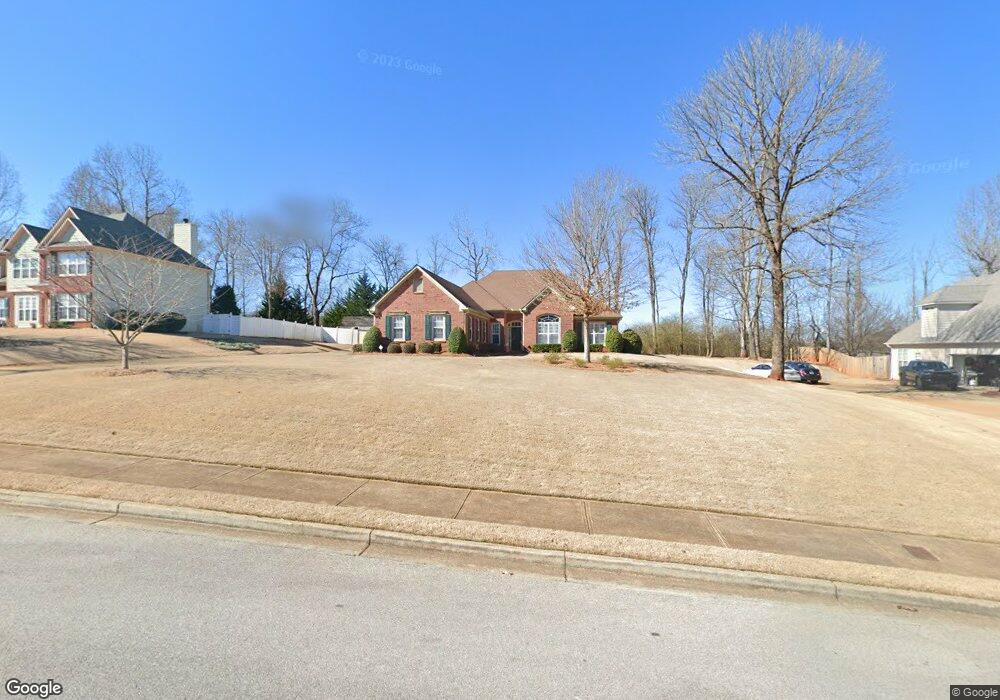
5026 Weatherstone Dr Buford, GA 30519
Estimated Value: $422,000 - $454,000
3
Beds
2
Baths
2,082
Sq Ft
$212/Sq Ft
Est. Value
About This Home
This home is located at 5026 Weatherstone Dr, Buford, GA 30519 and is currently estimated at $440,824, approximately $211 per square foot. 5026 Weatherstone Dr is a home located in Gwinnett County with nearby schools including Duncan Creek Elementary School, Frank N. Osborne Middle School, and Mill Creek High School.
Ownership History
Date
Name
Owned For
Owner Type
Purchase Details
Closed on
Dec 10, 2015
Sold by
Karallus Heather
Bought by
Greer C David and Greer Catherine L
Current Estimated Value
Purchase Details
Closed on
Jul 18, 2013
Sold by
Smith Grafton
Bought by
Smith Heather
Purchase Details
Closed on
Apr 30, 2010
Sold by
Landreneau Christopher O and Landreneau Lucille S
Bought by
Smith Grafton and Smith Heather
Home Financials for this Owner
Home Financials are based on the most recent Mortgage that was taken out on this home.
Original Mortgage
$147,200
Interest Rate
5.06%
Mortgage Type
New Conventional
Purchase Details
Closed on
Dec 3, 1999
Sold by
Northstar Homes Llc
Bought by
Landreneau Christopher O and Landreneau Lucille S
Home Financials for this Owner
Home Financials are based on the most recent Mortgage that was taken out on this home.
Original Mortgage
$153,990
Interest Rate
7.99%
Mortgage Type
New Conventional
Create a Home Valuation Report for This Property
The Home Valuation Report is an in-depth analysis detailing your home's value as well as a comparison with similar homes in the area
Home Values in the Area
Average Home Value in this Area
Purchase History
| Date | Buyer | Sale Price | Title Company |
|---|---|---|---|
| Greer C David | $225,000 | -- | |
| Smith Heather | -- | -- | |
| Smith Grafton | $184,000 | -- | |
| Landreneau Christopher O | $171,100 | -- |
Source: Public Records
Mortgage History
| Date | Status | Borrower | Loan Amount |
|---|---|---|---|
| Previous Owner | Smith Grafton | $147,200 | |
| Previous Owner | Landreneau Christopher O | $153,990 |
Source: Public Records
Tax History Compared to Growth
Tax History
| Year | Tax Paid | Tax Assessment Tax Assessment Total Assessment is a certain percentage of the fair market value that is determined by local assessors to be the total taxable value of land and additions on the property. | Land | Improvement |
|---|---|---|---|---|
| 2025 | $4,687 | $159,240 | $44,000 | $115,240 |
| 2024 | $4,742 | $154,360 | $40,000 | $114,360 |
| 2023 | $4,742 | $148,320 | $35,840 | $112,480 |
| 2022 | $4,230 | $131,280 | $31,200 | $100,080 |
| 2021 | $3,768 | $106,560 | $24,400 | $82,160 |
| 2020 | $3,791 | $106,560 | $24,400 | $82,160 |
| 2019 | $3,247 | $87,280 | $24,400 | $62,880 |
| 2018 | $3,248 | $87,280 | $24,400 | $62,880 |
| 2016 | $3,174 | $78,720 | $15,200 | $63,520 |
| 2015 | $2,652 | $69,000 | $15,200 | $53,800 |
| 2014 | -- | $67,600 | $15,200 | $52,400 |
Source: Public Records
Map
Nearby Homes
- 5036 Weatherstone Dr
- 4693 Devencrest Ln
- 4642 Devencrest Ln Unit 1
- 2808 Turnwater St
- 2264 Oak Falls Ln
- 5153 Morrell Rd
- 5704 Miravista Way
- 5213 Morrell Rd
- 5222 Morrell Rd
- 2424 Pinnae Place
- 5051 Adler Ct
- 5687 Villa Crest Dr
- 3138 Lantana Way
- 2342 Sparta Way
- 5378 Thompson Mill Rd
- 5709 Grapewood St
- 5730 Nantucket Row
- 4732 Moon Chase Dr
- 5006 Weatherstone Dr
- 5029 Weatherstone Dr
- 5046 Weatherstone Dr
- 5019 Weatherstone Dr
- 5039 Weatherstone Dr
- 4996 Weatherstone Dr
- 5009 Weatherstone Dr Unit 73
- 5009 Weatherstone Dr
- 5056 Weatherstone Dr
- 7600 Spout Springs Rd
- 5059 Weatherstone Dr
- 4999 Weatherstone Dr
- 4986 Weatherstone Dr Unit 2
- 0 Weatherstone Dr
- 2440 Pemberton Point
- 2430 Pemberton Point Unit 1
- 5069 Weatherstone Dr
- 2460 Pemberton Point
- 5076 Weatherstone Dr
- 2450 Pemberton Point