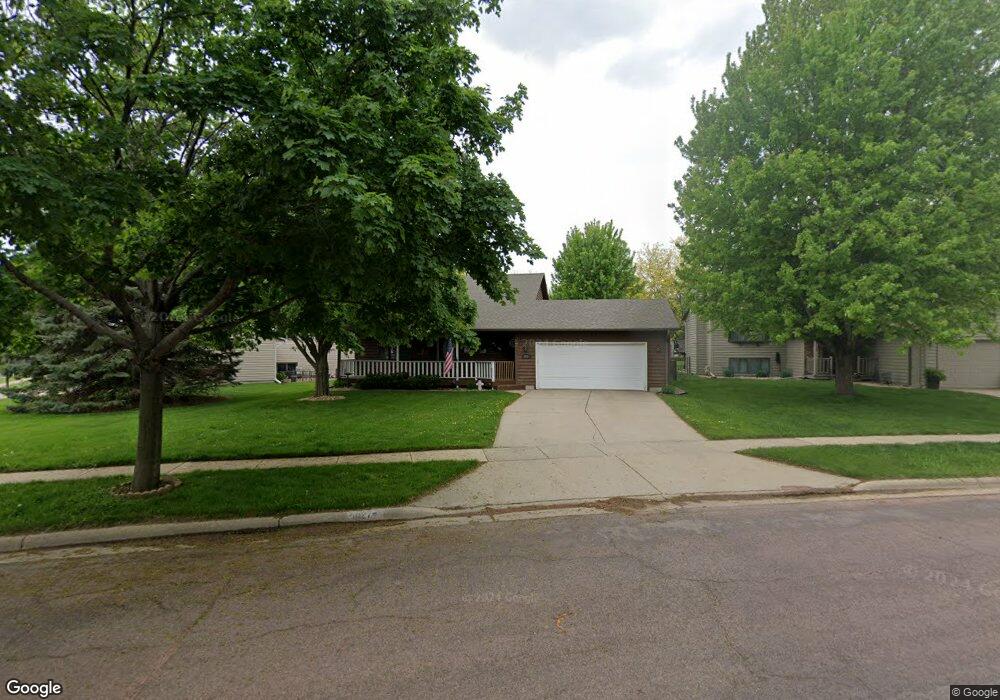
5027 E Havenhill Dr Sioux Falls, SD 57110
East Side NeighborhoodEstimated Value: $341,000 - $381,000
3
Beds
3
Baths
1,830
Sq Ft
$194/Sq Ft
Est. Value
About This Home
This home is located at 5027 E Havenhill Dr, Sioux Falls, SD 57110 and is currently estimated at $355,746, approximately $194 per square foot. 5027 E Havenhill Dr is a home located in Minnehaha County with nearby schools including Rosa Parks Elementary School, Washington High School, and Train Up A Child Preschool/Kindergarten.
Ownership History
Date
Name
Owned For
Owner Type
Purchase Details
Closed on
Jan 3, 2022
Sold by
Platinum Properties Llc
Bought by
Woods Ray B and Woods Ramona L
Current Estimated Value
Purchase Details
Closed on
Apr 13, 2021
Sold by
Buswell David T and Buswell Jamie L
Bought by
Platinum Properties Llc
Home Financials for this Owner
Home Financials are based on the most recent Mortgage that was taken out on this home.
Original Mortgage
$239,000
Interest Rate
3%
Mortgage Type
Future Advance Clause Open End Mortgage
Purchase Details
Closed on
May 23, 2014
Sold by
Robert L Robert L and Mckellep Susan R
Bought by
Buswell David T and Buswell Jamie L
Home Financials for this Owner
Home Financials are based on the most recent Mortgage that was taken out on this home.
Original Mortgage
$166,250
Interest Rate
4.28%
Mortgage Type
New Conventional
Create a Home Valuation Report for This Property
The Home Valuation Report is an in-depth analysis detailing your home's value as well as a comparison with similar homes in the area
Home Values in the Area
Average Home Value in this Area
Purchase History
| Date | Buyer | Sale Price | Title Company |
|---|---|---|---|
| Woods Ray B | $274,000 | -- | |
| Woods Ray B | $274,000 | -- | |
| Platinum Properties Llc | $274,000 | Stewart Title Company | |
| Buswell David T | $175,000 | -- |
Source: Public Records
Mortgage History
| Date | Status | Borrower | Loan Amount |
|---|---|---|---|
| Previous Owner | Platinum Properties Llc | $239,000 | |
| Previous Owner | Buswell David T | $166,250 |
Source: Public Records
Tax History
| Year | Tax Paid | Tax Assessment Tax Assessment Total Assessment is a certain percentage of the fair market value that is determined by local assessors to be the total taxable value of land and additions on the property. | Land | Improvement |
|---|---|---|---|---|
| 2024 | $5,101 | $305,500 | $33,000 | $272,500 |
| 2023 | $5,179 | $295,400 | $33,000 | $262,400 |
| 2022 | $4,025 | $269,600 | $33,000 | $236,600 |
| 2021 | $3,587 | $213,000 | $0 | $0 |
| 2020 | $3,587 | $230,300 | $0 | $0 |
| 2019 | $3,444 | $217,023 | $0 | $0 |
| 2018 | $3,083 | $207,735 | $0 | $0 |
| 2017 | $3,034 | $194,764 | $28,179 | $166,585 |
| 2016 | $3,034 | $191,815 | $28,179 | $163,636 |
| 2015 | $2,962 | $179,930 | $26,613 | $153,317 |
| 2014 | -- | $169,070 | $26,571 | $142,499 |
Source: Public Records
Map
Nearby Homes
- 2213 S Saddle Ridge Dr
- 2212 S Saddle Ridge Dr
- 2208 S Saddle Ridge Dr
- 2309 S Red Oak Ave
- 2305 S Red Oak Ave
- 2300 Saddle Ridge Dr
- 2304 Saddle Ridge Dr
- 2400 Saddle Ridge Dr
- 2312 Saddle Ridge Dr
- 2308 Saddle Ridge Dr
- 2408 Saddle Ridge Dr
- 2412 Saddle Ridge Dr
- 2404 Saddle Ridge Dr
- 5117 E Blueridge Dr
- 2205 S Red Oak Ave
- 2112 Saddle Ridge Dr
- 2201 S Red Oak Ave
- 2109 S Red Oak Ave
- 2409 S Red Oak Ave
- 2413 S Red Oak Ave
- 5008 E Centennial Ln
- 5025 E Havenhill Dr
- 5023 E Havenhill Dr
- 5000 E Centennial Ln
- 2404 S Avondale Ave
- 2400 S Avondale Ave
- 2408 S Avondale Ave
- 5026 E Havenhill Dr
- 2308 S Avondale Ave
- 2304 S Avondale Ave
- 5005 E Centennial Ln
- 5021 E Havenhill Dr
- 5024 E Havenhill Dr
- 5022 E Havenhill Dr
- 5009 E Centennial Ln
- 5001 E Centennial Ln
- 5017 E Havenhill Dr
- 2300 S Avondale Ave
- 2309 S Avondale Ave
- 5020 E Havenhill Dr
Your Personal Tour Guide
Ask me questions while you tour the home.