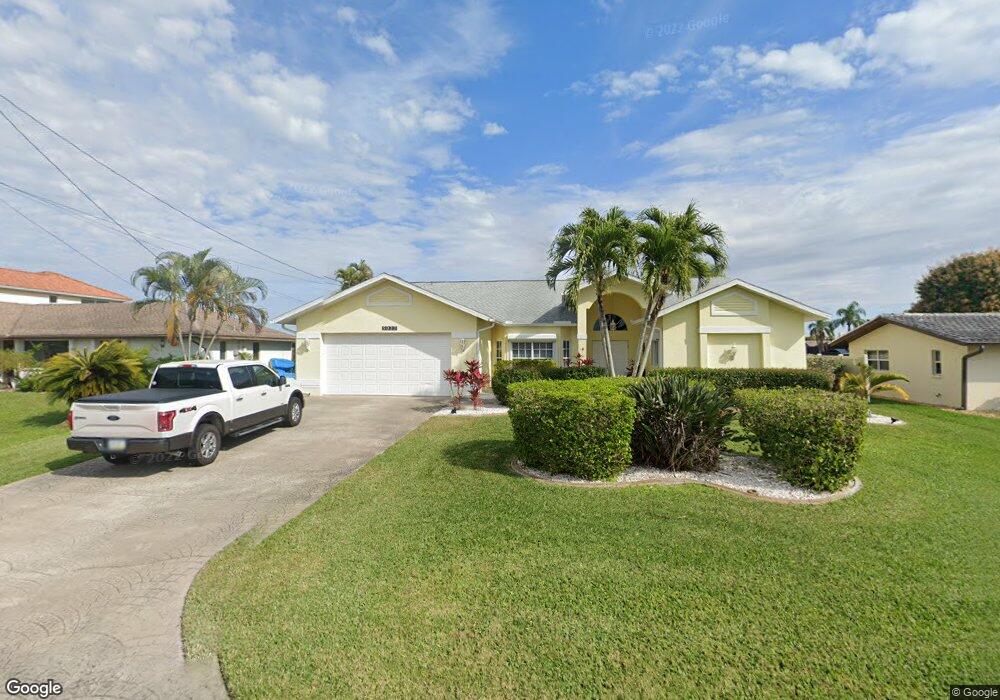
5027 SW 5th Place Cape Coral, FL 33914
Pelican NeighborhoodEstimated Value: $717,983 - $967,000
3
Beds
2
Baths
3,330
Sq Ft
$260/Sq Ft
Est. Value
About This Home
This home is located at 5027 SW 5th Place, Cape Coral, FL 33914 and is currently estimated at $865,746, approximately $259 per square foot. 5027 SW 5th Place is a home located in Lee County with nearby schools including Cape Elementary School, Caloosa Elementary School, and Tropic Isles Elementary School.
Ownership History
Date
Name
Owned For
Owner Type
Purchase Details
Closed on
Mar 22, 2019
Sold by
Whittaker Craig M and Whittaker Susan Anthea
Bought by
Cape Escape Llc
Current Estimated Value
Home Financials for this Owner
Home Financials are based on the most recent Mortgage that was taken out on this home.
Original Mortgage
$221,280
Outstanding Balance
$168,902
Interest Rate
4.3%
Mortgage Type
Commercial
Estimated Equity
$696,844
Purchase Details
Closed on
Aug 13, 2008
Sold by
Tcif Reo Gcm Llc
Bought by
Whittaker Craig M and Whittaker Susan Anthea
Purchase Details
Closed on
Jun 4, 2008
Sold by
Bencivenga Joseph
Bought by
Tcif Reo Gcm Llc
Purchase Details
Closed on
Sep 28, 2007
Sold by
Bencivenga Joseph
Bought by
Speedy Renovation Llc
Purchase Details
Closed on
Aug 16, 2000
Sold by
Hamilton Peter J and Hamilton Nancy K
Bought by
Bencivenga Joseph and Bencivenga Iris
Home Financials for this Owner
Home Financials are based on the most recent Mortgage that was taken out on this home.
Original Mortgage
$183,750
Interest Rate
8.24%
Create a Home Valuation Report for This Property
The Home Valuation Report is an in-depth analysis detailing your home's value as well as a comparison with similar homes in the area
Home Values in the Area
Average Home Value in this Area
Purchase History
| Date | Buyer | Sale Price | Title Company |
|---|---|---|---|
| Cape Escape Llc | $459,000 | Florida Hometown T&E Llc | |
| Whittaker Craig M | $360,000 | Watson Title Ins Agency Inc | |
| Tcif Reo Gcm Llc | -- | None Available | |
| Speedy Renovation Llc | -- | Attorney | |
| Bencivenga Joseph | $245,000 | -- |
Source: Public Records
Mortgage History
| Date | Status | Borrower | Loan Amount |
|---|---|---|---|
| Open | Cape Escape Llc | $221,280 | |
| Previous Owner | Bencivenga Joseph | $183,750 |
Source: Public Records
Tax History Compared to Growth
Tax History
| Year | Tax Paid | Tax Assessment Tax Assessment Total Assessment is a certain percentage of the fair market value that is determined by local assessors to be the total taxable value of land and additions on the property. | Land | Improvement |
|---|---|---|---|---|
| 2025 | $11,218 | $680,334 | $503,073 | $143,550 |
| 2024 | $11,722 | $660,758 | $491,192 | $135,674 |
| 2023 | $11,722 | $600,767 | $0 | $0 |
| 2022 | $10,417 | $546,152 | $0 | $0 |
| 2021 | $9,239 | $496,502 | $321,036 | $175,466 |
| 2020 | $8,775 | $451,408 | $316,000 | $135,408 |
| 2019 | $8,812 | $455,423 | $316,000 | $139,423 |
| 2018 | $8,447 | $447,343 | $301,000 | $146,343 |
| 2017 | $7,673 | $376,295 | $262,000 | $114,295 |
| 2016 | $7,775 | $378,224 | $272,521 | $105,703 |
| 2015 | $7,890 | $374,814 | $234,652 | $140,162 |
| 2014 | $7,728 | $356,198 | $220,428 | $135,770 |
| 2013 | -- | $346,599 | $167,482 | $179,117 |
Source: Public Records
Map
Nearby Homes
- 605 SW 51st Terrace
- 617 SW 51st Terrace
- 510 SW 51st Terrace
- 706 SW 51st Terrace
- 421 SW 51st Terrace
- 719 SW 51st Terrace
- 5024 Pelican Blvd
- 5024 Skyline Blvd
- 5031 Pelican Blvd
- 5015 Pelican Blvd
- 4902 SW 5th Place
- 5103 Pelican Blvd
- 603 SW 53rd Terrace
- 5122 SW 3rd Ave
- 5134 SW 3rd Ave
- 813 SW 52nd St
- 5208 SW 3rd Ave
- 5036 SW 8th Place
- 5127 SW 3rd Ave
- 5031 SW 5th Place
- 5023 SW 5th Place
- 5019 SW 5th Place
- 5028 SW 5th Place
- 5024 SW 5th Place
- 5032 SW 5th Place
- 5035 SW 5th Place
- 5015 SW 5th Place
- 5020 SW 5th Place
- 521 SW 51st Terrace
- 5036 SW 5th Place
- 5016 SW 5th Place
- 517 SW 51st Terrace
- 5011 SW 5th Place
- 541 SW 51st Terrace
- 513 SW 51st Terrace
- 5007 SW 5th Place
- 530 SW 51st Terrace
- 526 SW 51st Terrace