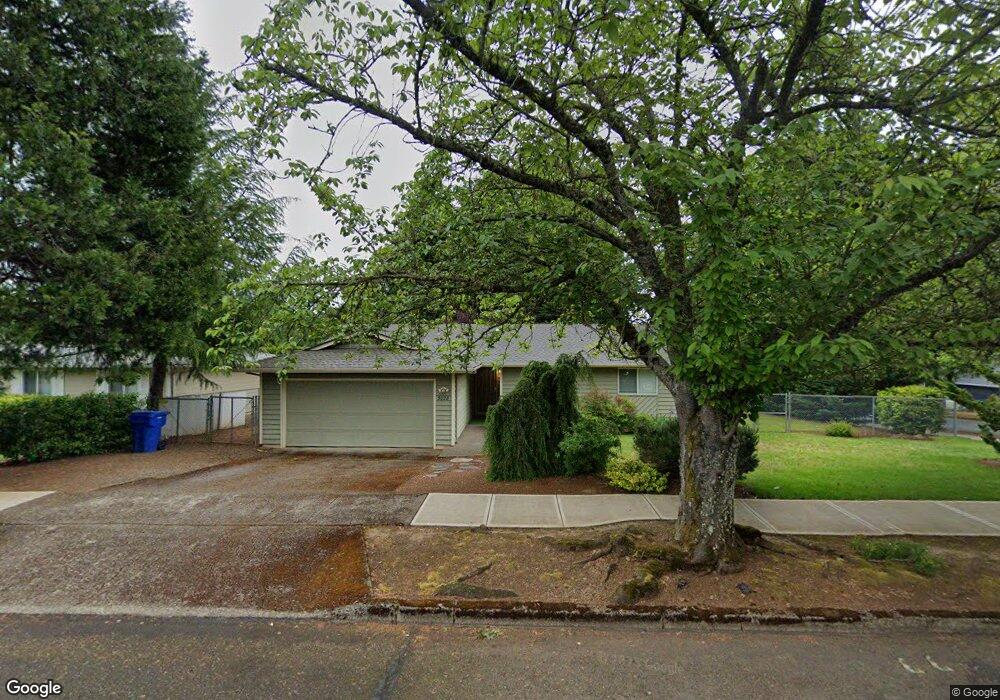
5028 Daniel St S Salem, OR 97306
Sunnyslope NeighborhoodEstimated Value: $390,000 - $459,000
3
Beds
2
Baths
1,279
Sq Ft
$329/Sq Ft
Est. Value
About This Home
This home is located at 5028 Daniel St S, Salem, OR 97306 and is currently estimated at $420,209, approximately $328 per square foot. 5028 Daniel St S is a home located in Marion County with nearby schools including Liberty Elementary School, Crossler Middle School, and Sprague High School.
Ownership History
Date
Name
Owned For
Owner Type
Purchase Details
Closed on
Sep 30, 2014
Sold by
Ohlsen Kieth V and Johnston Dianna S
Bought by
Ohlsen Kieth and The Kieth V Ohlsen Revocable Living Trus
Current Estimated Value
Purchase Details
Closed on
May 11, 2006
Sold by
Thompson Jeffrey and Thompson Janna
Bought by
Ohlsen Kieth and Johnston Dianna S
Home Financials for this Owner
Home Financials are based on the most recent Mortgage that was taken out on this home.
Original Mortgage
$140,000
Outstanding Balance
$79,729
Interest Rate
6.3%
Mortgage Type
Fannie Mae Freddie Mac
Estimated Equity
$340,480
Purchase Details
Closed on
Nov 28, 1995
Sold by
Noble Kenneth R and Noble Judy A
Bought by
Thompson Jeffrey C and Thompson Janna L
Create a Home Valuation Report for This Property
The Home Valuation Report is an in-depth analysis detailing your home's value as well as a comparison with similar homes in the area
Home Values in the Area
Average Home Value in this Area
Purchase History
| Date | Buyer | Sale Price | Title Company |
|---|---|---|---|
| Ohlsen Kieth | -- | None Available | |
| Ohlsen Kieth | $182,000 | Ticor Title | |
| Thompson Jeffrey C | $99,500 | Amerititle |
Source: Public Records
Mortgage History
| Date | Status | Borrower | Loan Amount |
|---|---|---|---|
| Open | Ohlsen Kieth | $140,000 |
Source: Public Records
Tax History Compared to Growth
Tax History
| Year | Tax Paid | Tax Assessment Tax Assessment Total Assessment is a certain percentage of the fair market value that is determined by local assessors to be the total taxable value of land and additions on the property. | Land | Improvement |
|---|---|---|---|---|
| 2025 | $3,616 | $189,710 | -- | -- |
| 2024 | $3,616 | $184,190 | -- | -- |
| 2023 | $3,510 | $178,830 | $0 | $0 |
| 2022 | $3,309 | $173,630 | $0 | $0 |
| 2021 | $3,215 | $168,580 | $0 | $0 |
| 2020 | $3,121 | $163,670 | $0 | $0 |
| 2019 | $3,012 | $158,910 | $0 | $0 |
| 2018 | $3,065 | $0 | $0 | $0 |
| 2017 | $2,766 | $0 | $0 | $0 |
| 2016 | $2,635 | $0 | $0 | $0 |
| 2015 | $2,655 | $0 | $0 | $0 |
| 2014 | $2,569 | $0 | $0 | $0 |
Source: Public Records
Map
Nearby Homes
- 4835 Talisman Ct S
- 1556 Joplin St S
- 5042 Cumberland Ct SE Unit 18
- 1382 Kashmir Dr S
- 1878 Joseph St S
- 4664 17th Ave S
- 205 Rd Unit 37
- 1884 Skyline Village Loop S
- 4537 Kurth St S
- 5270 Chapman St S
- 5275 Parker Ct S
- 5087 Terrylee Ct SE
- 5198 Skyline Rd S
- 304 Boone Rd SE
- 5358 Sparta Loop SE
- 5401 E Ridge St S
- 1245 Tamara Ave S
- 4935 Coloma Dr SE
- 2217 Juliet Ct S
- 4845 Coloma Dr SE
- 5026 Daniel St S
- 1357 Ronelle St S
- 5029 Geoff St S
- 5024 Daniel St S
- 5029 Daniel St S
- 1366 Ronelle St S
- 5025 Daniel St S
- 5027 Geoff St S
- 5033 Daniel St S
- 1346 Ronelle St S
- 5021 Daniel St S
- 5020 Daniel St S
- 1284 Ronelle St S
- 5037 Daniel St S
- 5023 Geoff St S
- 4926 14th Place S
- 1257 Ronelle St S
- 4936 14th Place S
- 4916 14th Place S
- 5026 Geoff St S